![]()

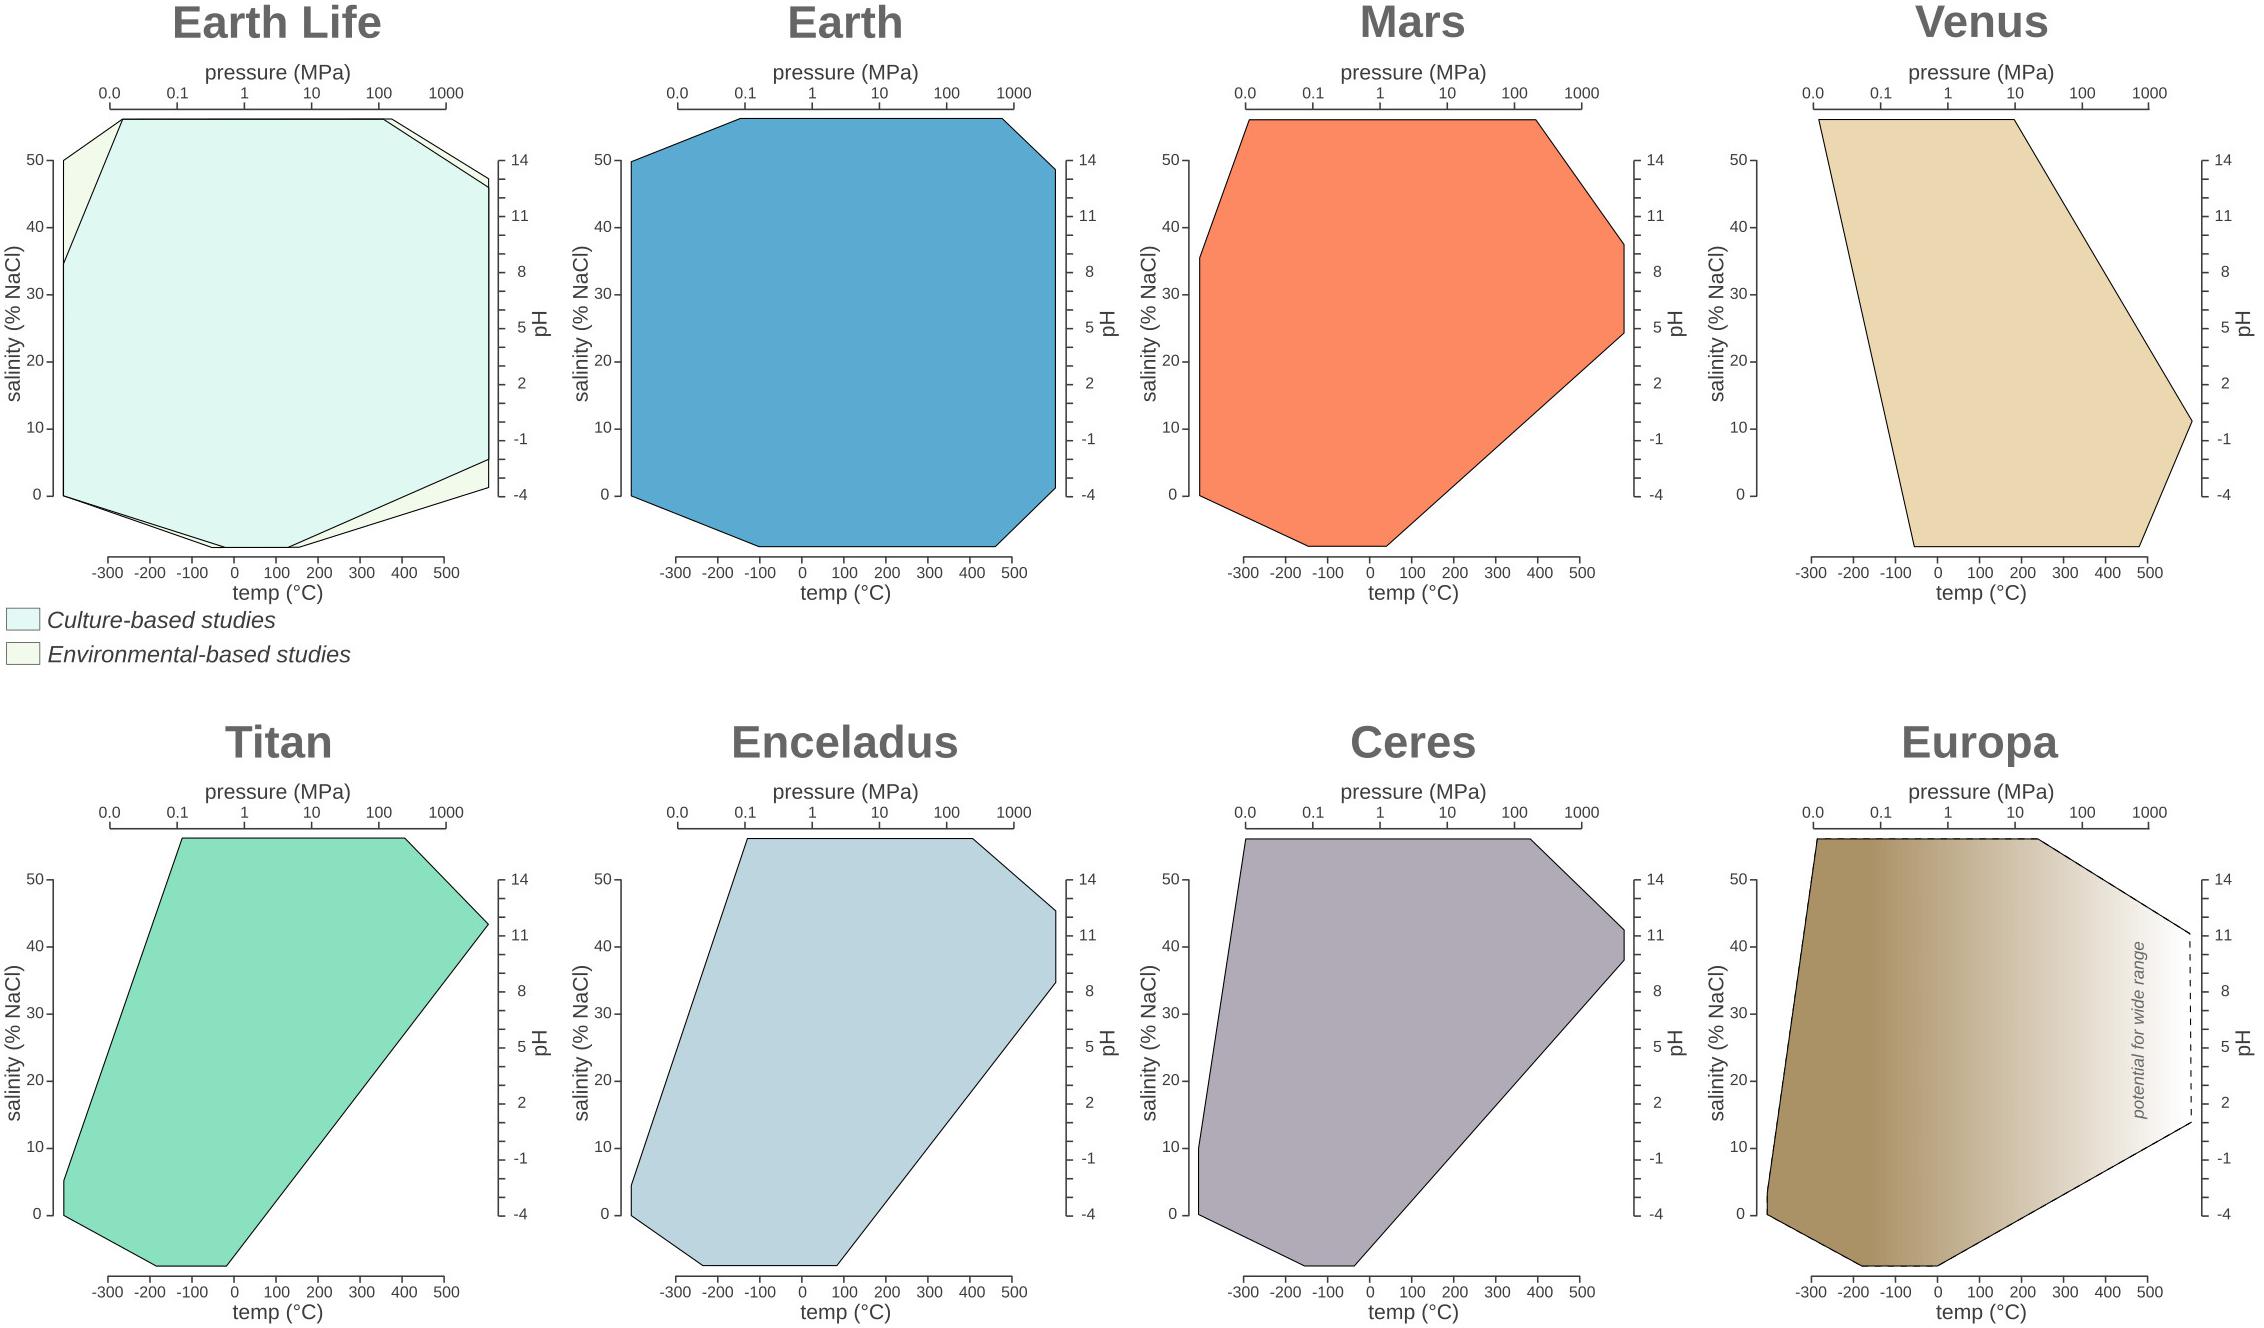
A Polygon plot (singular, Polygons plot, plural) is designed to
visualize multivariate ranges as opposite to single data points. The
concept of polygons plot was developed by Donato
Giovannelli in late 2018 while
working on our review Living at the Extremes: Extremophiles and the
Limits of Life in a Planetary
Context, published in 2019 in
Frontiers in Microbiology.
A complete explanation of how polygon plot works can be found at https://giovannellilab.github.io/polygonPlot/.
Story Details
While working on the review, he started collecting data regarding the range (minimum and maximum) for physico-chemical parameters of Earth’s life such as pH, temperature, salinity and pressure. He wanted to visualize the ranges of these variables in a single plot, but I could not find a simple way to do it. After some research and a lot of doodling, the polygons plot was born!
You can install the development version of polygonPlot from GitHub with:
# install.packages("devtools")
devtools::install_github("giovannellilab/polygonPlot")This is a basic example which shows you how to solve a common problem:
library(polygonPlot)

df <- read.csv(system.file(file.path("extdata", "example.csv"), package="polygonPlot"))
df
#>        info data1 data2 data3 data4 data5 data6
#> 1  axis_min  -300    -4     0     0    NA  -0.5
#> 2  axis_max   500    14  1000    50    NA   0.5
#> 3      data   300    -2    10    20     5   0.1
#> 4             320    12    50    40    10   0.3
#> 5             340    NA    90    NA    NA    NA
#> 6             360    NA   130    NA    NA    NA
#> 7             380    NA   170    NA    NA    NA
#> 8             400    NA   210    NA    NA    NA
#> 9             420    NA    NA    NA    NA    NA
#> 10            440    NA    NA    NA    NA    NA
#> 11            460    NA    NA    NA    NA    NA
plot <- polygonplot(df, shape = 4, fillcolor = "#57cc99", linecolor = "#38a3a5",
labels_axis = c("Earth", "Mercury", "Venus", "Mars"))
plot
library(polygonPlot)
library(ggplot2)The polygonplot function requires two mandatory parameters:
df: the inputdata.framethat should be composed as follows:- The first column should contain the strings
axis_min,axis_maxanddatain that row order. - All the columns, starting from the second, must be dedicated to the
variables of interest. In particular, the first two rows should
contain the values for the
axis_minandaxis_maxrespectively.- If left empty, the axis_min/max will be automatically calculated
based on data given and extension will be decided based on the
Axes range extension (
extraparameter).
- If left empty, the axis_min/max will be automatically calculated
based on data given and extension will be decided based on the
Axes range extension (
- Starting from the third row, each variable column must contain all the data values.
- As default, column names will be used as labels of the axis (starting from the second one). Change them in order to change the labels, but don’t leave them empty.
- The first column should contain the strings
shape: theintegervalue indicating the shape of the polygon. Available numbers:3for Triangle4for Square5for Pentagon6for Hexagon
Examples of the input data.frame
df <- read.csv(system.file(file.path("extdata", "example.csv"), package="polygonPlot"))
df
#>        info data1 data2 data3 data4 data5 data6
#> 1  axis_min  -300    -4     0     0    NA  -0.5
#> 2  axis_max   500    14  1000    50    NA   0.5
#> 3      data   300    -2    10    20     5   0.1
#> 4             320    12    50    40    10   0.3
#> 5             340    NA    90    NA    NA    NA
#> 6             360    NA   130    NA    NA    NA
#> 7             380    NA   170    NA    NA    NA
#> 8             400    NA   210    NA    NA    NA
#> 9             420    NA    NA    NA    NA    NA
#> 10            440    NA    NA    NA    NA    NA
#> 11            460    NA    NA    NA    NA    NA
a minimal version
df_min <- read.csv(system.file(file.path("extdata", "minimal_example.csv"),
                               package="polygonPlot"))
df_min
#>       info data1 data2 data3 data4 data5 data6
#> 1 axis_min  -300    -4     0     0    NA  -0.5
#> 2 axis_max   500    14  1000    50    NA   0.5
#> 3     data   300    -2    10    20     5   0.1
#> 4 460 12 270 40 10 0.3extra: axis range extensionfillcolor: fill color of the polygonalpha: alpha value of the fill colorlinecolor: line color of the polygon borderlinetype: line type of the polygon borderlwd: line width of the polygon borderlabels_axis: vector with the desired labels of the axistitle: title of the plotfix_aspect_ratio: boolean flag to fix the aspect ratio of the plot as1. It is strongly recommended to leave it as default valueTRUE.- NOTE: If you are going to change the theme of the returned
ggplot object, remember to put in the
themefunction the following codeaspect.ratio = 1in order to keep the text and the relative ticks aligned on the axis.
- NOTE: If you are going to change the theme of the returned
ggplot object, remember to put in the
See the section About the aspect.ratio for a practical example.
ggplot2object.
plot_triangle <- polygonplot(df, shape = 3, fillcolor = "#e56b6f", linecolor = "#b56576",
                             labels_axis = c("earth", "moon", "sun"))
plot_triangle
plot_square <- polygonplot(df, shape = 4, fillcolor = "#57cc99", linecolor = "#38a3a5")
plot_square
plot_pentagon <- polygonplot(df, shape = 5, fillcolor = "#c89f9c", linecolor = "#b36a5e")
plot_pentagon
plot_hexagon <- polygonplot(df, shape = 6, fillcolor = "#0077b6", linecolor = "#023e8a")
plot_hexagon
As described above, the polygonplot function return a ggplot2
object. If you are going to change the theme of the returned ggplot
object, it is strongly recommended to specify in the theme function
the aspect.ratio = 1 in order to keep the text and the relative ticks
aligned on the axis.
plot_pentagon <- polygonplot(df, shape = 5, fillcolor = "#c89f9c", linecolor = "#b36a5e")
plot_pentagon + theme_bw() + theme(aspect.ratio = 1)