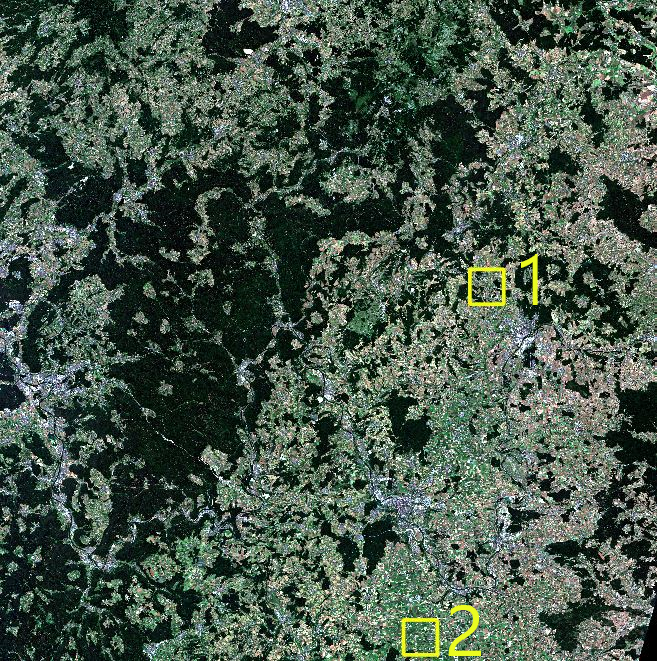
| Site 1 | img_data/S2Stack_20190704_bayern_1_small.tif |
| Site 2 | img_data/S2Stack_20190704_bayern_2_small.tif |
In all example data files the classes are assigned as follows:
| Class 1 | forest |
| Class 2 | agri |
| Class 3 | urban |
Important note: In the code, some functions will be run. Especially the saturationCheck() function can take very (>30 minutes) long (depending on selected parameter values).
For testing, I suggest to reduce the amount iterations and sampleValList_raw values. Nevertheless, this will most probably reduce the quality of the result.
Therefore, In the following I present some results I already calculated.
This function is the "base" of this script as it estimates the accuracy values for different numbers of samples.
function execution for site 1:
saturationDf_bayern_1 <-  saturationCheck(
  iterations = 6,
  sampleValList_raw = list(50, 100, 500, 1000, 1500, 2000, 3000, 4000),
  image = rgb_2019_bavaria_1,
  training = training_bavaria_1,
  validation = validation_bavaria_1
  )
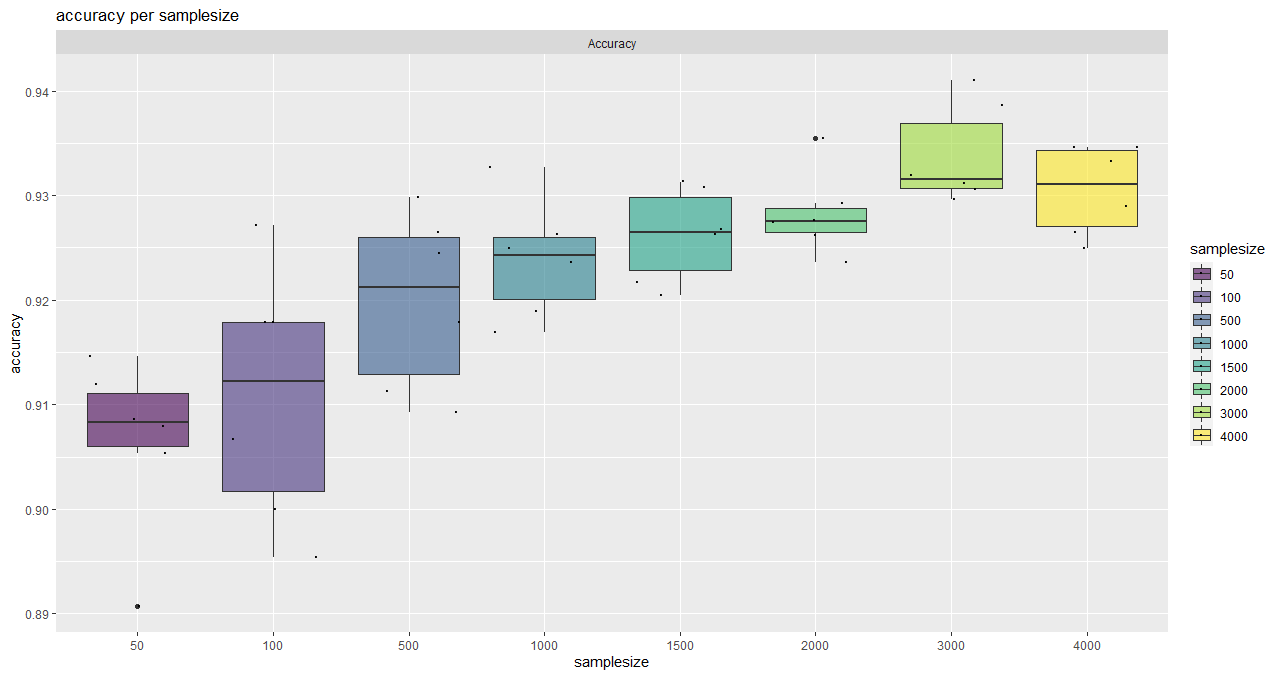
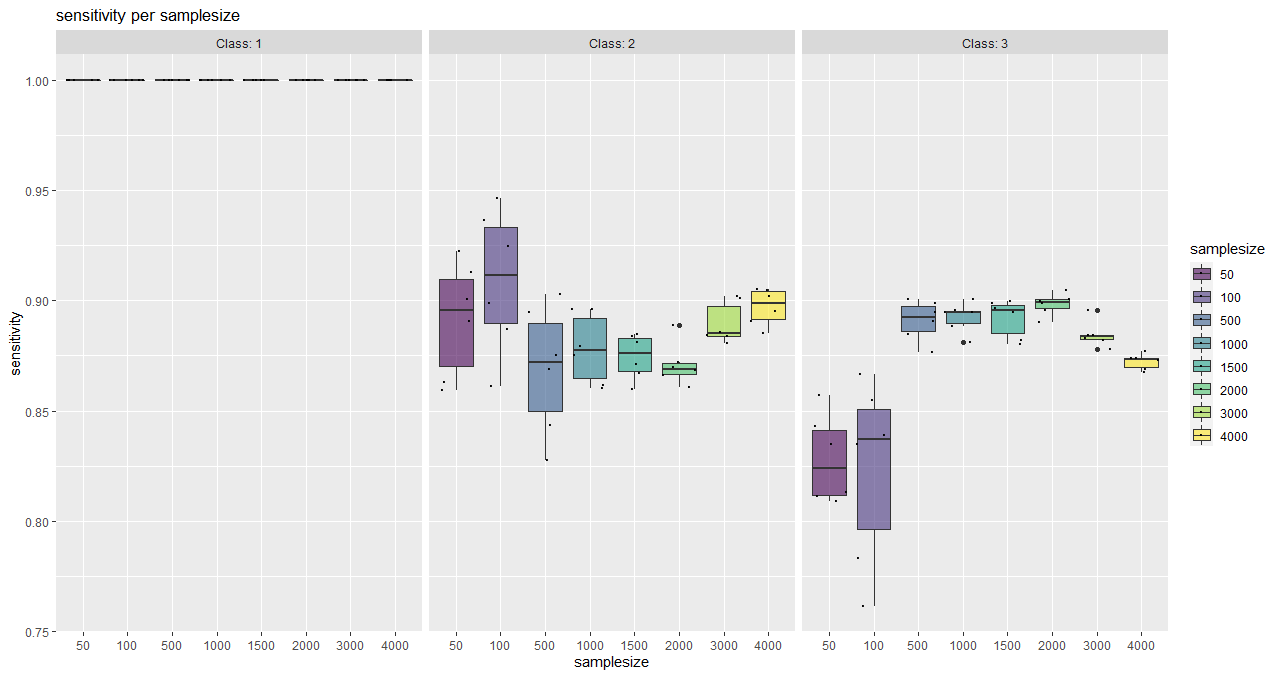
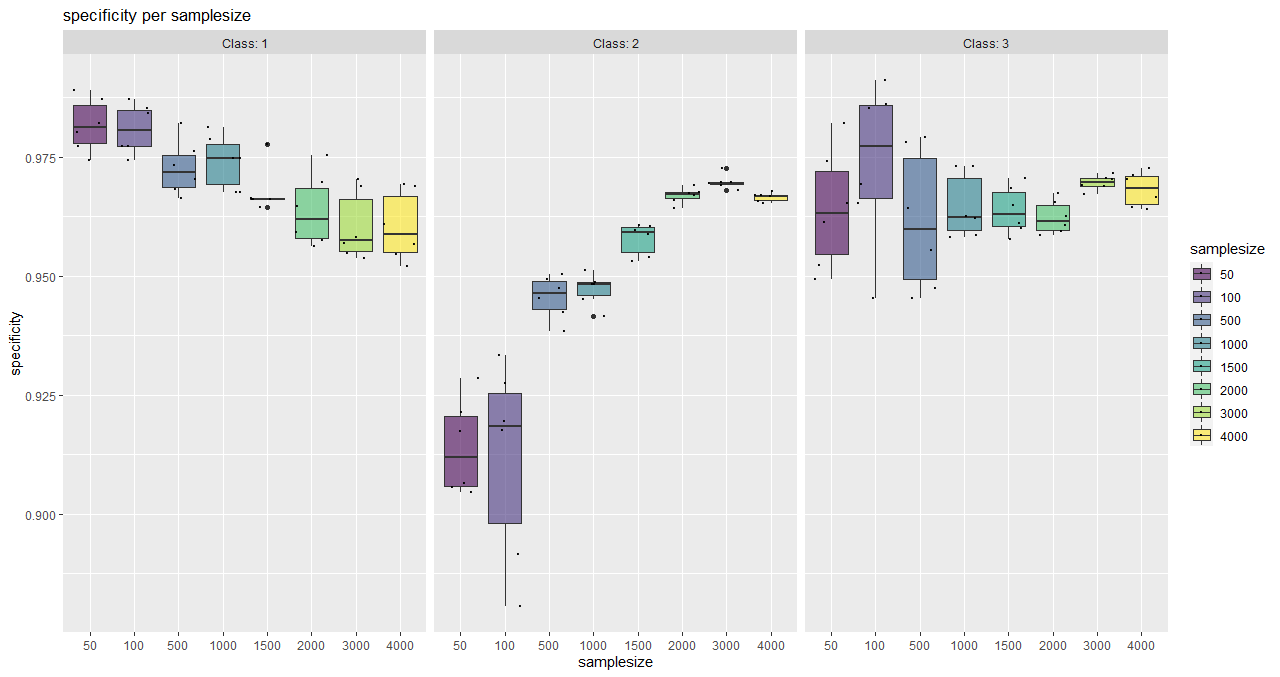
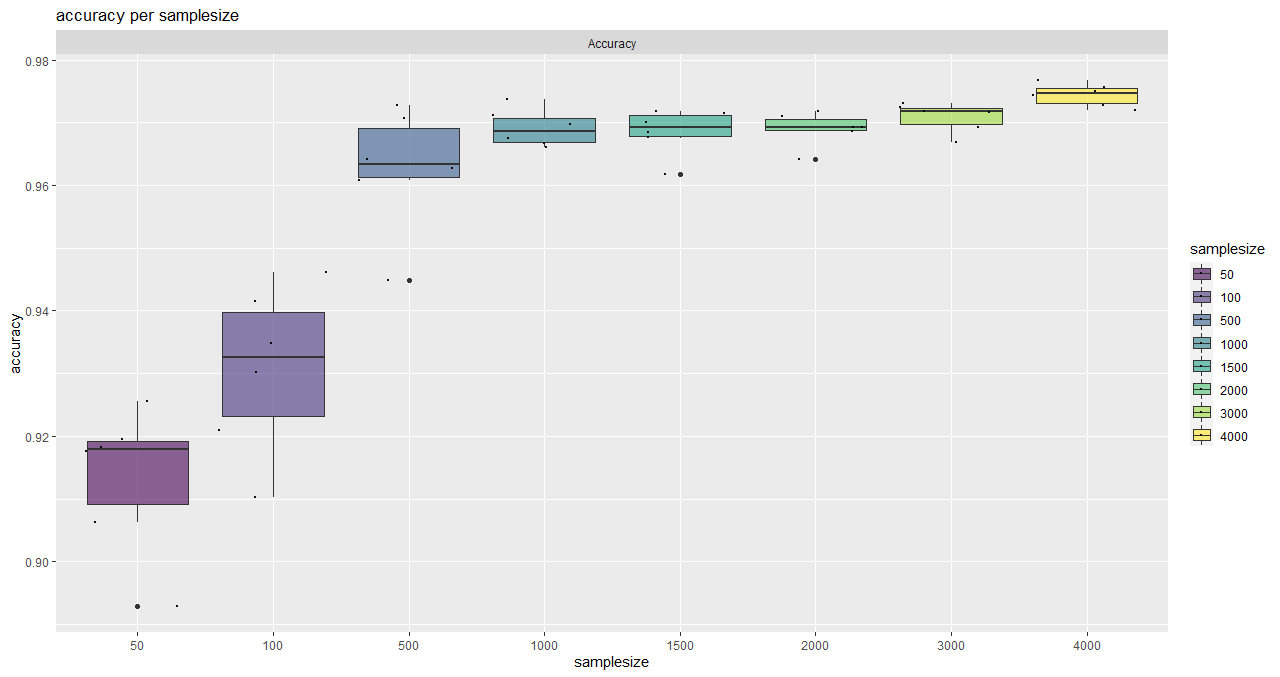
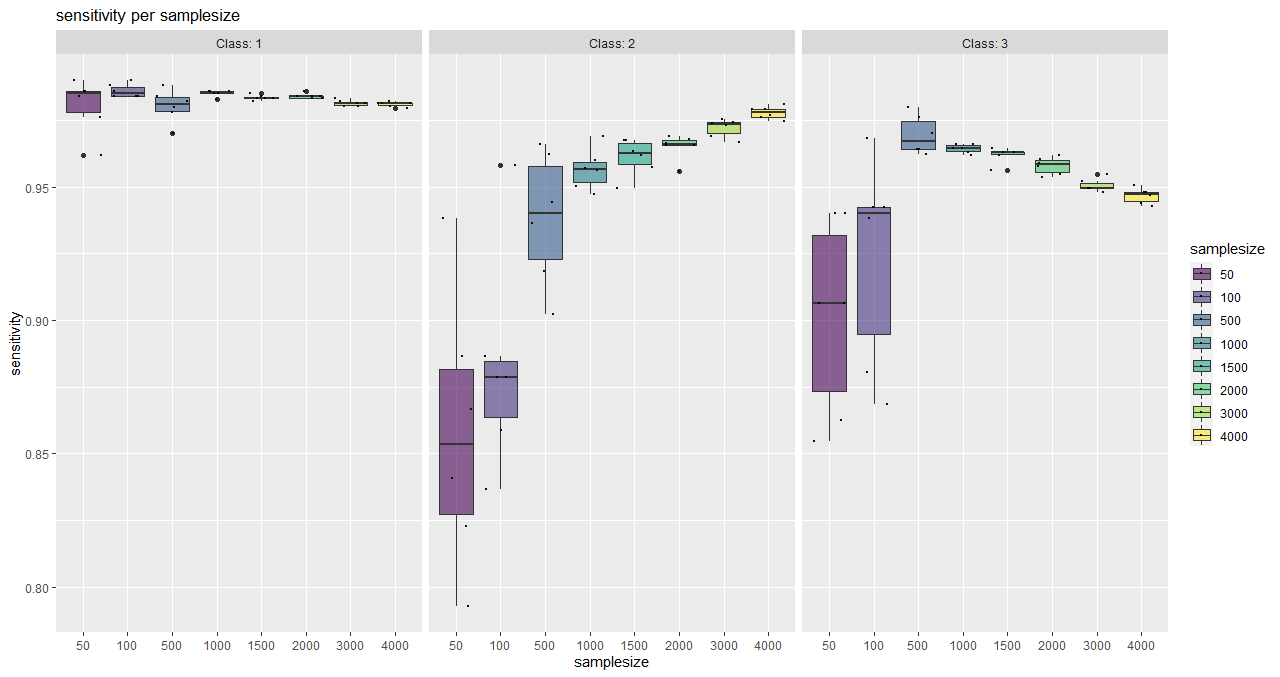
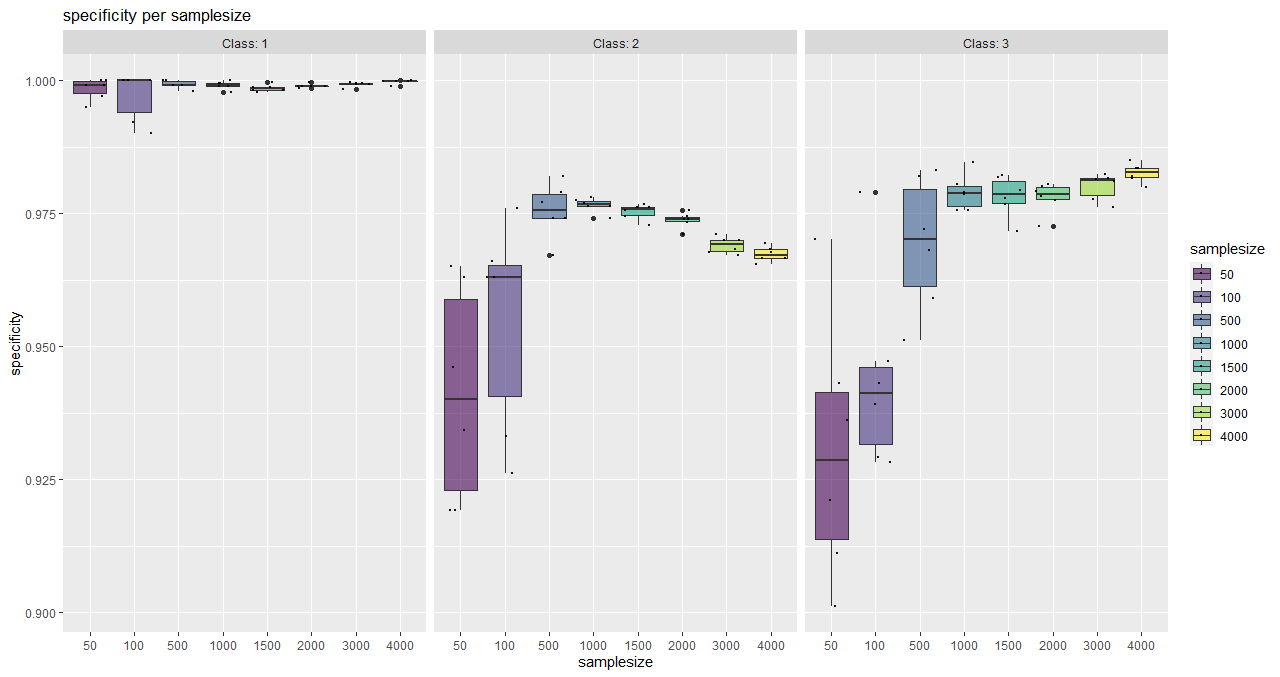
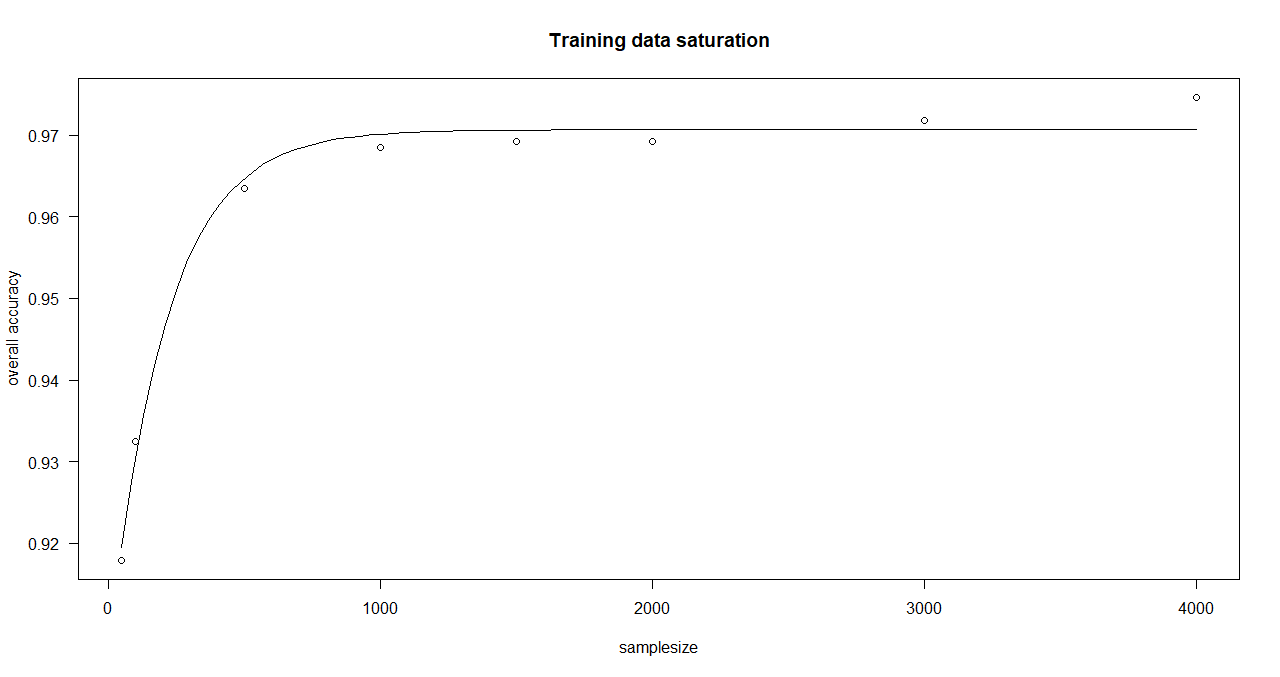
With this function, classwise sensitivity and specificity values can be plotted as well as overall accuracy values.
It serves as a tool for a visual (more subjective) saturation estimation and also shows the behaviour of individual classes.
function execution for site 1:
# accuracy
plotSaturationDf_bayern_1_acc <- saturationPlot(
  accuracyDf = saturationDf_bayern_1,
  attribute = "accuracy"
)

# sensitivity
plotSaturationDf_bayern_1_sens <- saturationPlot(
  accuracyDf = saturationDf_bayern_1,
  attribute = "sensitivity"
  )

# specificity
plotSaturationDf_bayern_1_spec <- saturationPlot(
  accuracyDf = saturationDf_bayern_1,
  attribute = "specificity"
)
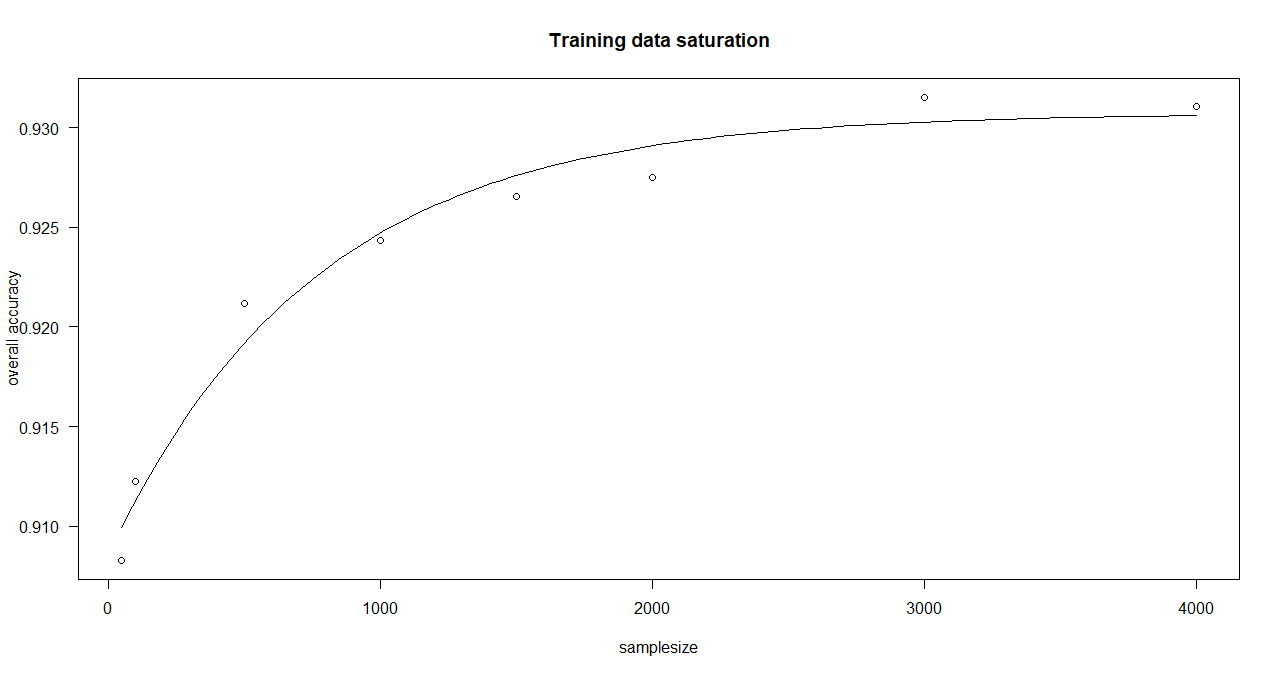
Here, an asymptotic regression model is adjusted to the median overall accuracy values of the accuracy data frame (provided by saturationCheck()).
function execution for site 1:
> curve_bayern_1 <- estimateCurve(saturationDf_bayern_1)
> curve_bayern_1

A 'drc' model.

Call:
drm(formula = values_1 ~ nSamples_1, fct = AR.3())

Coefficients:
c:(Intercept)  d:(Intercept)  e:(Intercept)
       0.9086         0.9307       766.8518
function execution for site 2:
> curve_bayern_2 <- estimateCurve(saturationDf_bayern_2)
> curve_bayern_2

A 'drc' model.

Call:
drm(formula = values_1 ~ nSamples_1, fct = AR.3())

Coefficients:
c:(Intercept)  d:(Intercept)  e:(Intercept)
       0.9056         0.9707       209.1066
This function returns the number of nSamples at which a saturation of the data can be expected.
The calculation is based on the regression curve (estimateCurve()) and a slope (provided by the user) at which the curve is defined as saturated.
> sampleSaturation(curve_bayern_1, 0.000001)
[1] 2579.789
> sampleSaturation(curve_bayern_2, 0.000001)
[1] 1200.392
Very basic script for the analysis of the influence on training data distribution on the accuracy of a classification.