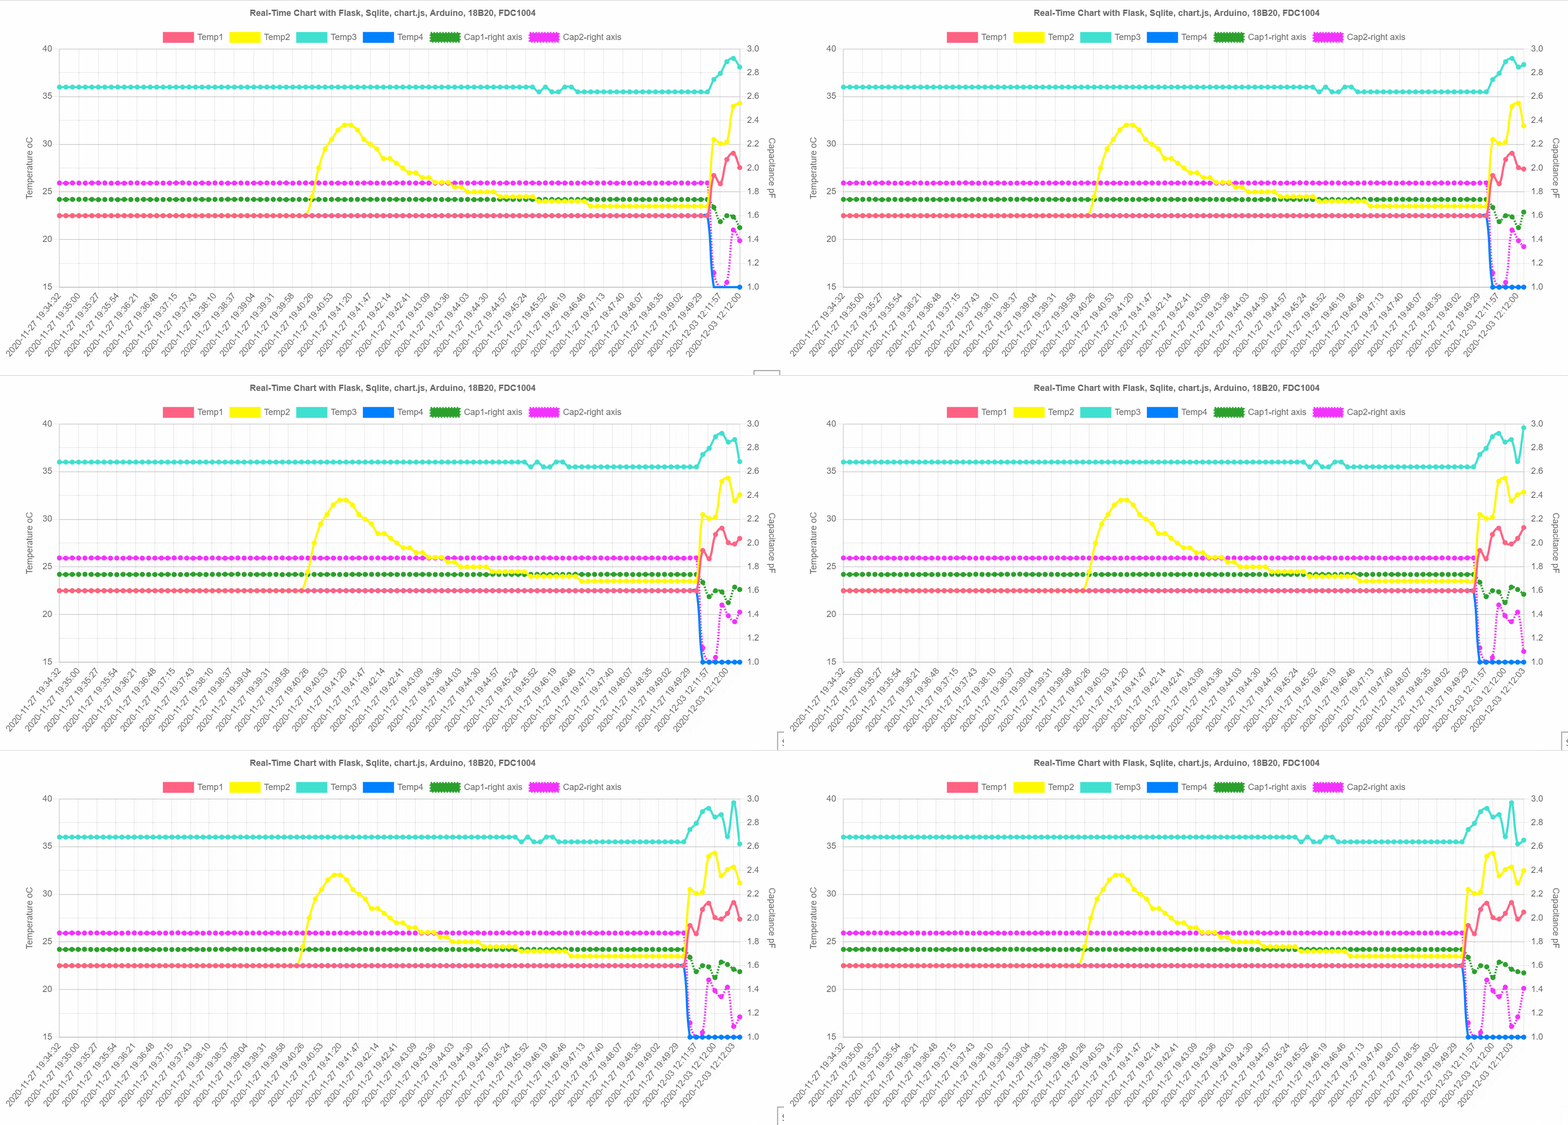
Real-Time Chart with Flask, Sqlite, chart.js, Arduino, 18B20, FDC1004
I am reading capacitance (TI FDC1004) and temperature (Maxim 18B20) using Arduino UNO
Arduino is connected to host computer (tested with Windows 10 laptop, will move to Rpi later) via USB
Data is stored on sqlite DB on the host computer
Realtime data visualized using chart.js
Steps
On Arduino
- Upload Arduino code and verify if sensor value is being read and printed to host serial port uses Protocentral_FDC1004 and DallasTemperature libraries
On Host 2) install python, pyserial, sqlite, flask
-
create a sqlite DB
-
run read_store.py to read CSV values from Arduino via USB serial interface and store it in sqlite db on host
-
create application.py change db location etc
-
create a subfolder template and create the index_graph.html
-
come back to application directiory and run application.py
-
access web page served by host
