In May 2017 Vanessa Barford reported on the "turnout gap" between younger and older voters. The article was supposed by analysis from the BBC Data Unit's Dan Wainwright and John Walton from the BBC Visual Journalism team.
- YouGov survey: voting intention (PDF)
- Google spreadsheet: Registered voters vs population by constituency. Note: Population estimates are for the 17+ age group as of mid-2015, the latest available. 17 year olds included as they would be 18 by the time the 2016 registration figures were compiled. Figures do not take account of residents who are not legally eligible to vote, eg immigrants or prisoners
- CSV: Registered voters vs population by constituency
- David Cowling, political opinion polling specialist, King's College London.
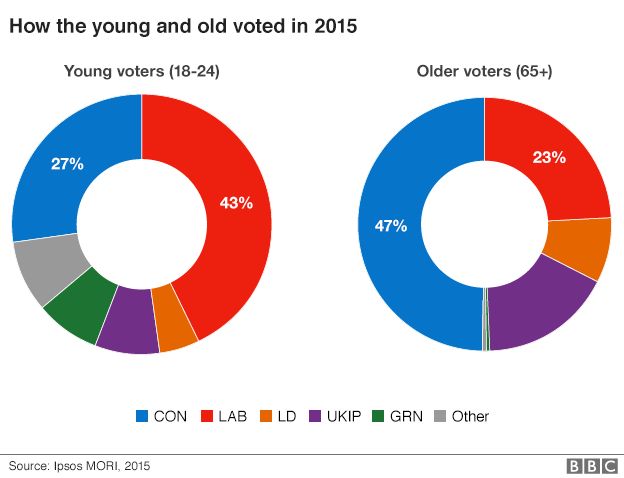
- Donut chart: How the young and old voted in 2015
- Bar chart: 10 constituencies with the highest percentage of voters aged 18-24
- Donut chart: proportion of voting age population by age group, 2015
- Stacked bar chart: How different age groups voted in the EU referendum
- Election 2017: Places with the lowest voter registration
- Election 2017: People turn to Google ahead of election
- How non-voters can change the outcome of an election
You can find all election-related stories in this GitHub account tagged 'elections'