This is a demo environment to show what's possible with the integration between Splunk and Hyperledger Fabric. To start the environment, first ensure that you have Docker installed.
https://docs.docker.com/get-docker/
Next, download the Hyperledger Fabric samples, binaries, and Docker images by running the curl command below.
curl -sSL http://bit.ly/2ysbOFE | bash -s -- 1.4.6 1.4.6 0.4.18
From there, you can simply run ./start.sh in this directory which will spin up all the necessary containers in your local docker environment. Splunk App for Hyperledger Fabric will be installed in Splunk and all the required channels will be created.
Once the channels are set up and transactions are flowing, you can log into Splunk which will be installed and accessible at http://localhost:8000. The username and password will be admin / changeme. Splunk may take up to a minute to start up because it requires downloading the Hyperledger App, you can watch the progress using docker logs -f splunk.example.com.
In order to submit transactions to the Hyperledger Fabric network, run the following command.
./start-txns.sh
In order to shutdown the environment, run ./stop.sh.
Once logged into Splunk, you can view the Hyperledger Fabric dashboards inside the Hyperledger Splunk application.
![]()
The vaccine tracking dashboard visualizes logistics data being sent to the blockchain (via the ./start-txns.sh command above). You can watch the dashboard update in front of you while transactions are being posted to the underlying Hyperledger Fabric network. Note that it will take 20-30 minutes to post enough transactions to populate the maps on the dashboard.
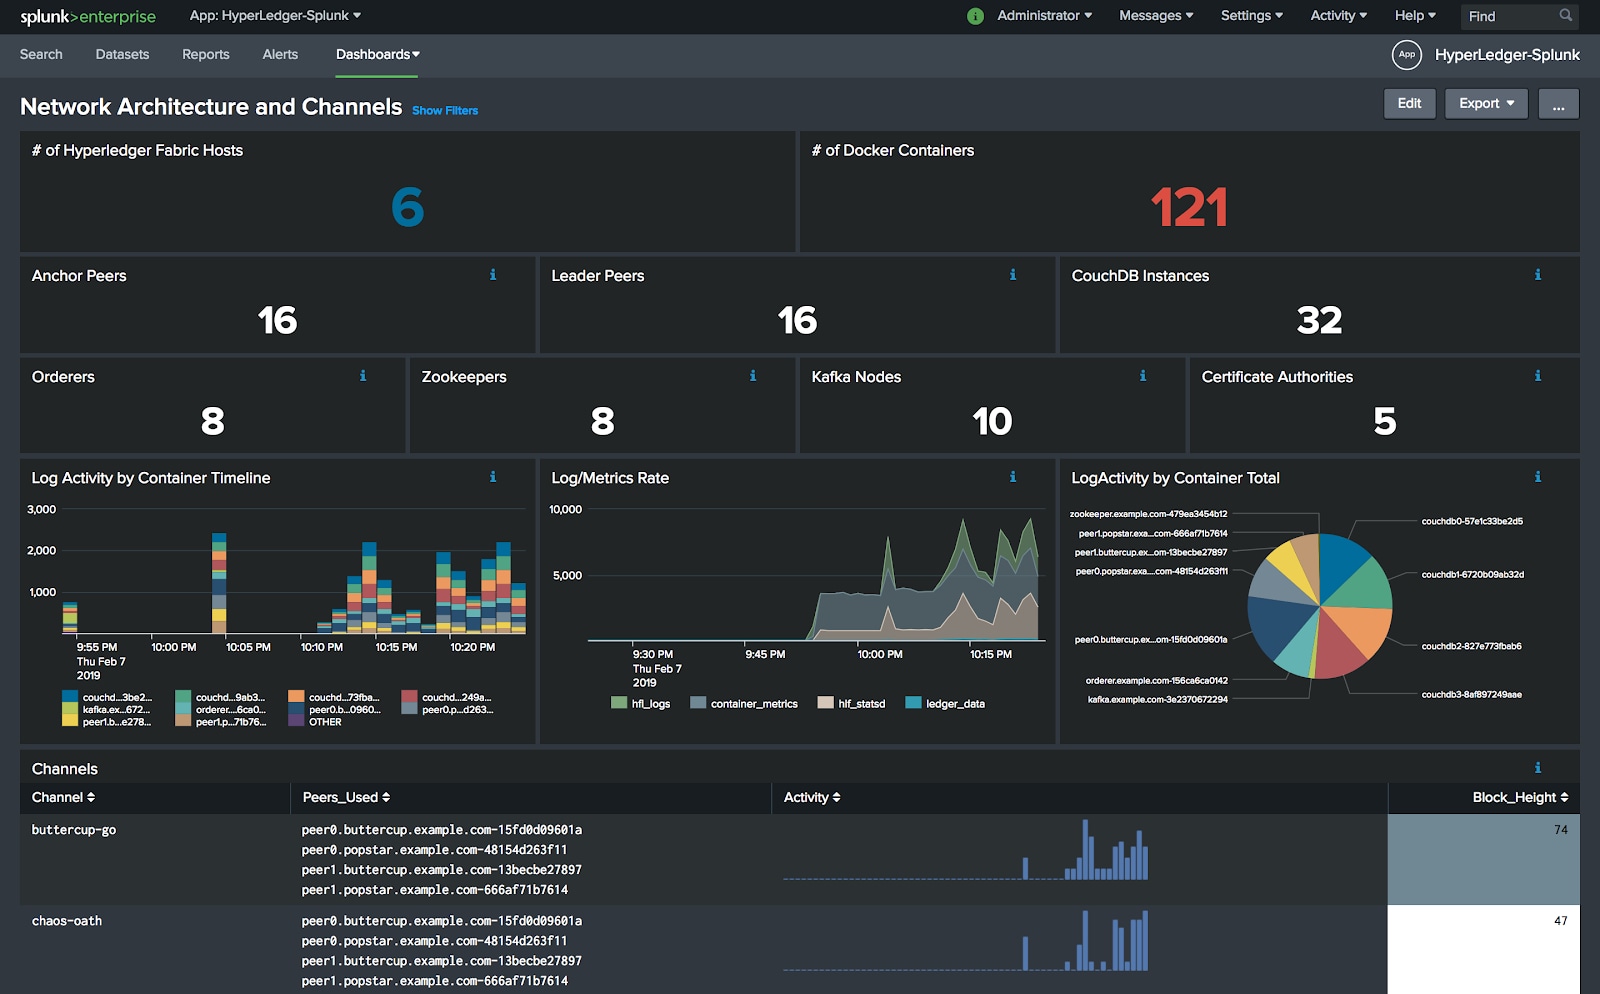
With the Network Architecture and Channels dashboard, you can see at a glance the number of orderers, peers, and channels in your Hyperledger Fabric network.
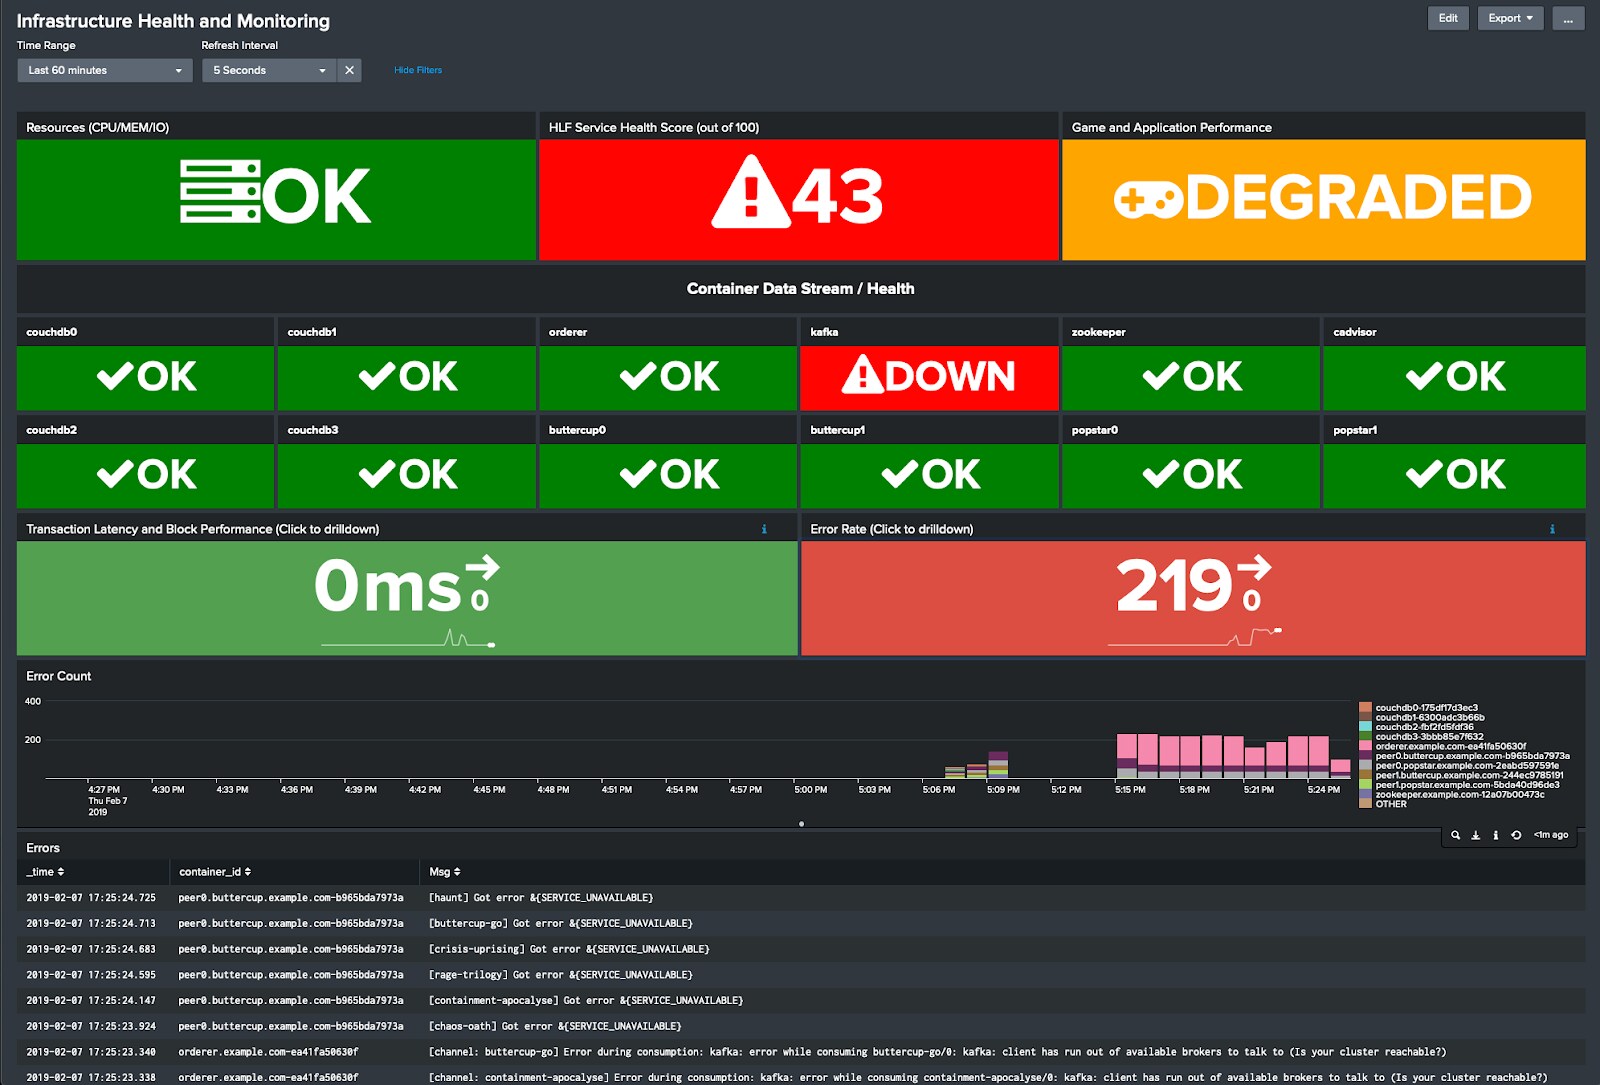
The Infrastructure Health and Monitoring dashboard will give you an overview of system health from system metrics like CPU, uptime status as well as transaction latency. You can see in real time when transactions are starting to back up or a peer is falling behind on blocks.
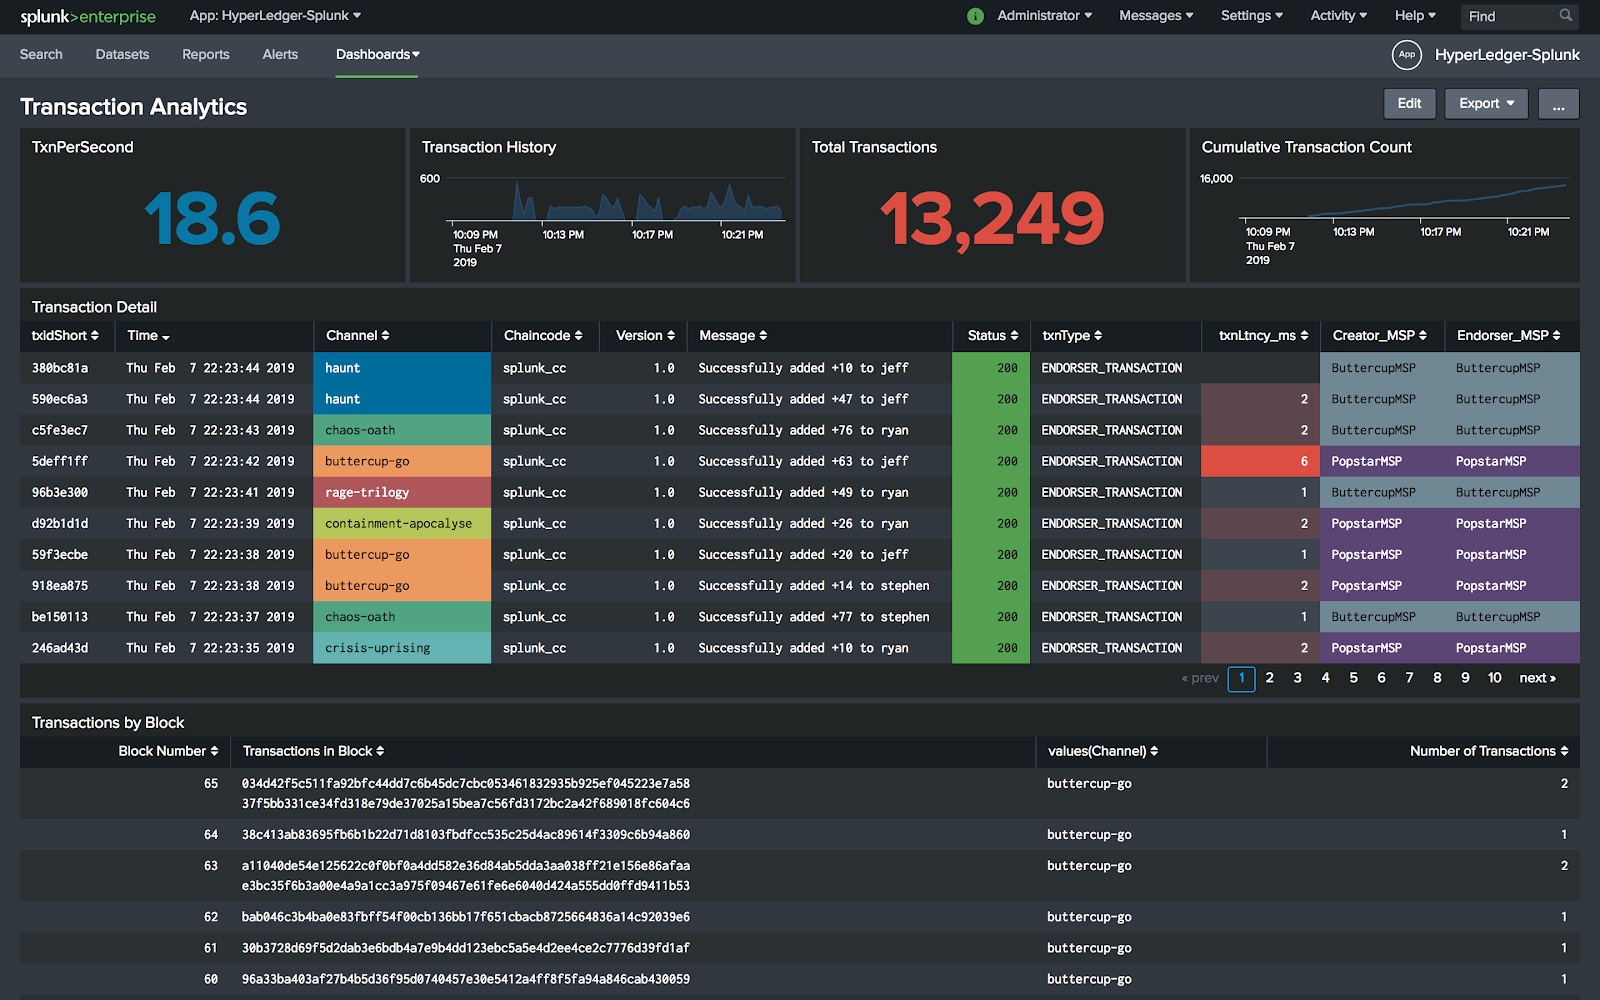
Our Transaction Analytics dashboard will give you real time visibility into the transactions being written on each ledger. In this dashboard, we’re blending ledger data sent from the peers with logs and metrics to give a holistic view of the network’s health.