#SYLLABUS
Find this resource here: http://tinyurl.com/webcoding-syllabus
###COURSE LOGISTICS: Eugene Lang School - The New School Sept. 2nd - Nov. 18th Wednesdays 6-7:50PM CRN: 7555 Credits: 2
Here is the course listing.
###INSTRUCTOR: Aurelia Moser @auremoser mosera@newschool.com
###OFFICE HOURS: Fridays 5-6PM, by appointment via gcal
###DESCRIPTION
Interactives and news apps are changing the way we process media, and the expectations for media producers in newsrooms globally. Data journalism departments and newsrooms like Vox, the NYTimes, ProPublica, and 538 build narrative and newsworthy tools around code; and the participatory nature of their media output invokes new languages and web fluencies. This course will introduce web development for newsroom interactives, including an introduction to web scripting languages, version control for collaborative coding, and the authorship of interactive narrative on the web. The goal of the course is to compliment student's existing coursework and interests with some essential coding skills, by course completion, helping them design, build, and deploy a data-driven, or news-inspired interactive. Students will workshop a news interactive of their own design throughout the course, punctuated by smaller exercises and lecture pairings on the topics of HTML5/CSS3, Javascript and contemporary development in data journalism.
###OBJECTIVE + LEARNING OUTCOMES Being successful in programming or journalism involves producing under deadline. Employers, editors and co-workers will require that you work efficiently. This course is modeled on your future success, and so deadlines will be applied to keep time with a professional pace. The final project for the course, and primary graded assignment, will depend on an agglutinative series of tasks designed to help you learn and think critically throughout the semester.
####LEARNING OUTCOMES:
- how to assess, manipulate, and analyze data
- how to bulletproof your data
- the merits of certain visualization types
- the mechanics of collaboration and github
- the basics of building interactive graphics: html/css/js
- the value of publishing and self-publishing
####GRADE CALCULATION: Here is a basic breakdown of graded tasks along that trajectory:
- 20% Attendance/Participation
- 20% Assignments
- 20% Project Proposal
- 40% Final Project, completed on conclusion of the course, submitted before Thanksgiving
TOTAL: 100%
It is understood that coding is tough and you may be new to this, you will be graded on your progress throughout the class, your ability to complete assignments on time, your interaction with peer reviewers, and your ability to justify your decisions thoughtfully; work hard and you'll do well.
###MATERIALS Coding is an art; you will have a series of art supplies for this course that will all be free unless otherwise noted, but will require some non-trivial investment on your part to set-up. I'm available to help if you need it.
SET-UP ACCOUNT
- Hosting Service - Github Account, signup here
DOWNLOAD AND INSTALL
- Text Editor - Sublime Text
- A Markdown Editor - Mou
LEARN
- Setting up a Server - Python Simple Server
###COURSE POLICIES
PARTNER POLICY
You will find a parter, or a triplet in this course and have some time afforded to workshop your ideas, your narratives and your code with them during peer review. They will give me feedback that contributes to your grade; so pair well with your peers.
ATTENDANCE/PARTICIPATION
Attendance accounts for 20% of your final grade.
ASSIGNMENTS
Each week you will have readings assigned, accompanied by often (but not always) an Assignment and a Practice activity. See the calendar below to confirm the expectations from week to week. I will grade your assignments and aggregate them as contributions to your final grade. Most assignments are working toward your Final Project, counting as 40% of your final grade.
- All assignments will be submitted via gist on your Github account.
- You can view a template of what your assignment should look like here: template and in this gist.
- Assignments are due on the following course date unless otherwise indicated. So, if readings and assignments are listed under 9/2, they are due by the following class date, 9/9, unless otherwise indicated.
| WEEK | DATE | ASSIGNMENT | PRACTICE | NOTE |
|---|---|---|---|---|
| 2 | 09/09 | Critique an interactive | X | |
| 3 | 09/16 | Evaluate platforms | X | GUESTS |
| 4 | 09/23 | Comparing interactives | X | NO CLASS |
| 5 | 09/30 | Dataset study | X | |
| 6 | 10/07 | Prototype 1: Time-Series/Stats | X | |
| 7 | 10/14 | Prototype 2: Mapping | X | |
| 8 | 10/21 | Prototype 3: Graphs | ||
| 9 | 10/28 | Style guide for Final Project | ||
| 10 | 11/04 | Proposal for Final Project | X | |
| 11 | 11/11 | Template your project | ||
| 12 | 11/18 | Peer review: groom projects with feedback | ||
| 13 | 11/24 | Final Presentations/Final Projects Due | DEMO |
READINGS
Readings are assigned to correspond with that week's assignment and class lesson. I'll be lecturing outside the readings with some references to them, and your assignments will allude to them too. Feel free to read ahead to make certain weeks easier.
There is no textbook for this course as most of the resources can be found for free online.
You can find the FULL BIBLIOGRAPHY in the repository for this course.
LEARNING CENTER
The University Learning Center has cool workshops that might be of use to you. There's one on November 5th, for Oral Presentations that you might consider attending to prep your project presentation at the end of the semester (November 24th for us).
#CLASS CALENDAR This course is 12 weeks long. Dates are based on the academic calendar for Eugene Lang.
##9/2/15 ####INTRO TO INTERACTIVES
"There were three strong consensus answers: first, get good at understanding and presenting data. Second, understand how social media can work as a newsroom tool. Third, get whatever newsroom experience you can working in teams, and in launching new things." ~ Clay Shirky
What is an interactive news app, and what is this course about? We'll talk about instances of success and failure in news apps, review some basics of this course and take care of some technical logistics to prep for next week.
Interactive to Inspire:
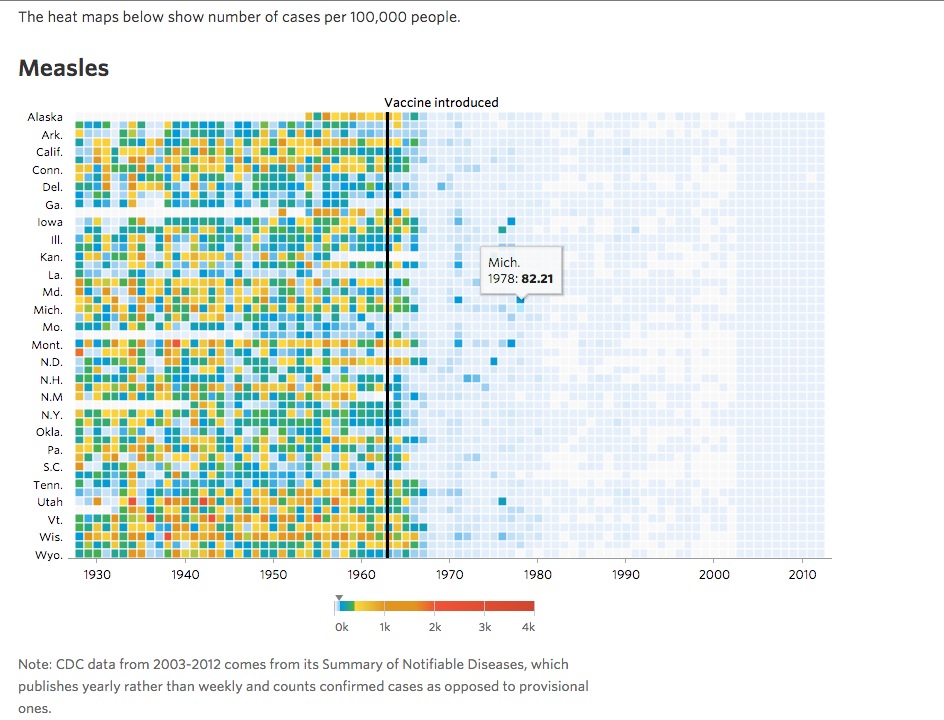
- WSJ Graphics, Infectionious Diseases and Vaccines.
####READINGS:
- Darnton, R., Writing and telling stories.
- Journalism Tools, How they did it.
- Norton, Q. The hypocrisy of the Internet journalist.
- Rosen, J., When to quit your journalism job.
- Shirky, C., Last call: the end of the printed newspaper.
####PRACTICE:
- Setup your Github accounts
- The Basics of Markdown Syntax, Daring Fireball
- CLI Handbook
- Terminal for Windows
- Terminal for Mac
We will go over this process, but you should practice some of the terminal commands and markdown syntax so that you feel comfortable on your own machines. We'll go over it next week.
####ASSIGNMENT Find an interactive that you appreciate, prefereably (but not obligatorily) a journalism piece. Write 2 paragraphs about why you chose it, what it is about, how the interactive/online medium chosen was particularly conducive to the narrative (or wasn't). Finally, explain how it was built, do some research to define what programming language it was written in; what was its creation story (if you can find it)?
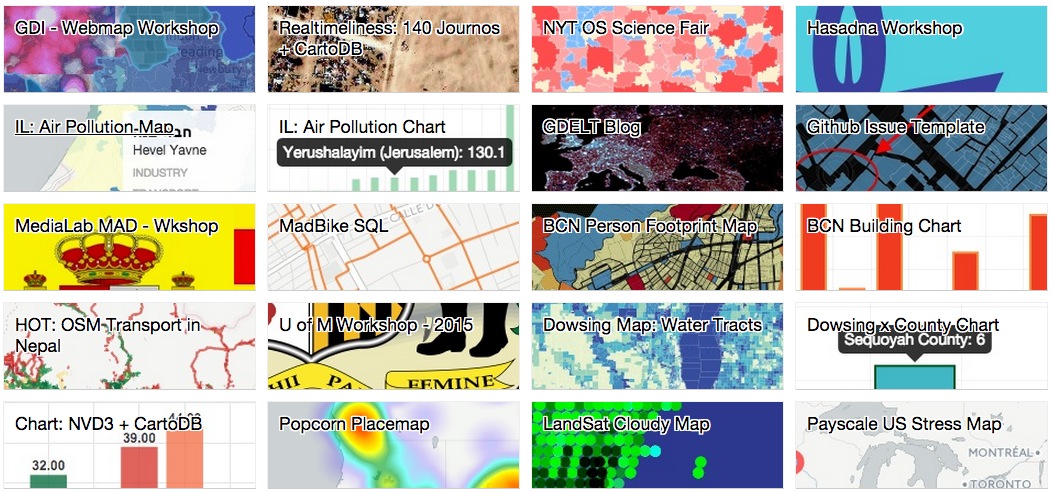
It could be something like an NPR multimedia piece, as complex as a ProPublica graphic, as iconic as Snowfall, as riveting as a graphic novel, or as arty as this exhibit of themed photos, but the effort to understand and document it should be the same. Extra points for finding something not on the list above, or review something in the 13pt Graphics list, a grouping assembled by the NYTimes.
Remember, you can view a template of what your assignment format here: template and in this gist.
##9/9/15 ####MARK-UP/DOWN: SELF-PUBLISHING IN INTERACTIVE NEWS
"I just wanted to share my view on the distinction I personally make between the two main types of visualization function: exploratory and explanatory" ~ A. Kirk
How can you be a journalist with integrity and intelligence in our contemporary world? You compete with social media, Medium, online platforms for editorializing quotidian experience. Your role is to provide information, unbiased but intelligible, this is the value you bring to your profession, and technologies gives you the media to communicate those values with clarity and immersive quality. This involves some code, but also concise research that guides readers to a greater understanding of the topics you are treating.
We'll talk about ways you can publish your work, and practice a few different methods of distributing narrative.
Interactive to Inspire:
- Rogers, S., Ramadan in Tweets with Odyssey.JS.
####READING
- Bengfort, B., Markup for Fast Data Science Publication.
- Kiss, J. and Arthur, C., Publishers or platforms? Media giants may be forced to choose.
OPTIONAL READINGS:
- Aaker, J., Persuasion and the power of the story.
- Kaufman, L., Bombings trip up Reddit in its turn in spotlight.
- Kirk, A., Storytelling and success stories.
####PRACTICE
Try to setup up a bl.ocks account based on your gists (the first few assignments for this course should suffice). Bl.ocks accounts like mine are based on gists, so you're already on your way to having an online interactive portfolio, yay! You can see blocks in action in today's Interactive to Inspire above, which links to the raw version of the interactive as well as the code (if you remove the raw in the URL).
This syllabus is written in markdown. You can study how it's made by looking at the format and the rendered version. Click on RAW (a button) in the Github view to compare, copy the raw text into Mou and view the side-by-side comparison.
- Bostock, M., Let's make a block
- Basics of HTML/CSS, Practice Site
Optionally, you can also go over some of the basics of HTML/CSS and web pages with this Khan Academy course, it will take an hour max.
####ASSIGNMENT Take a look at the following platforms for online journalism, consider the merits of each and choose one to profile. Explain in a few paragraphs why it appeals to you, what you might use it for, and describe how you tested it to confirm. Propose another method of self-publishing if you find none of these satisfactory, and explain why it seems superior.
Consider the readings an try include a sentence or two about how they are relevant to this exercise.
Link to your first bl.ock (see practice above). Write a sentence or two about how you might incorporate blocks into a larger narrative, or an interactive piece.
##9/16/15 ####NEW PLATFOR[U]MS: HOSTING FOR NEWS INTERACTIVES
This week we'll here from some interactive developers working in newsrooms in NYC. Our practice and assignment exercises will go over different approaches to similar topics in news and art, and ways that they might inspire eachother.
Guest Lecturers
Lena Groeger, ProPublica
Lena is a science journalist, developer, and designer at ProPublica, an investigative journalism group with a focus on longitudinal stories and throughful interactives. She'll give a talk on her work, and then you can all head home and work on the readings/assignments for this week.
She's worked on interactive projects like:
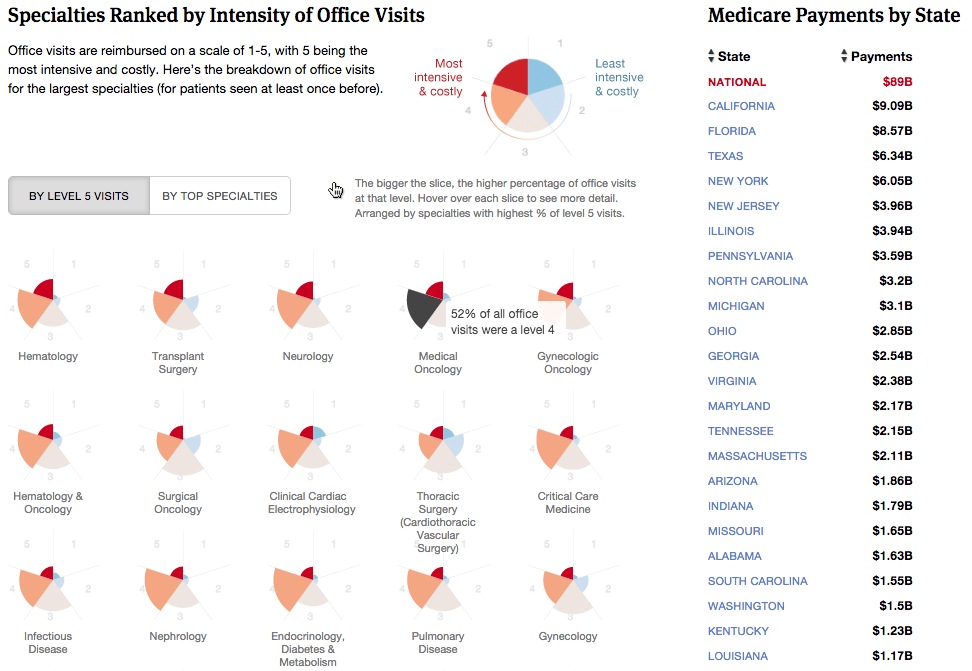
ProPublica, Treatment tracker.
#####Nadja Popovich, The Guardian US
Nadja is an interactive journalist at the Guardian U.S.
She's worked on interactive projects like:
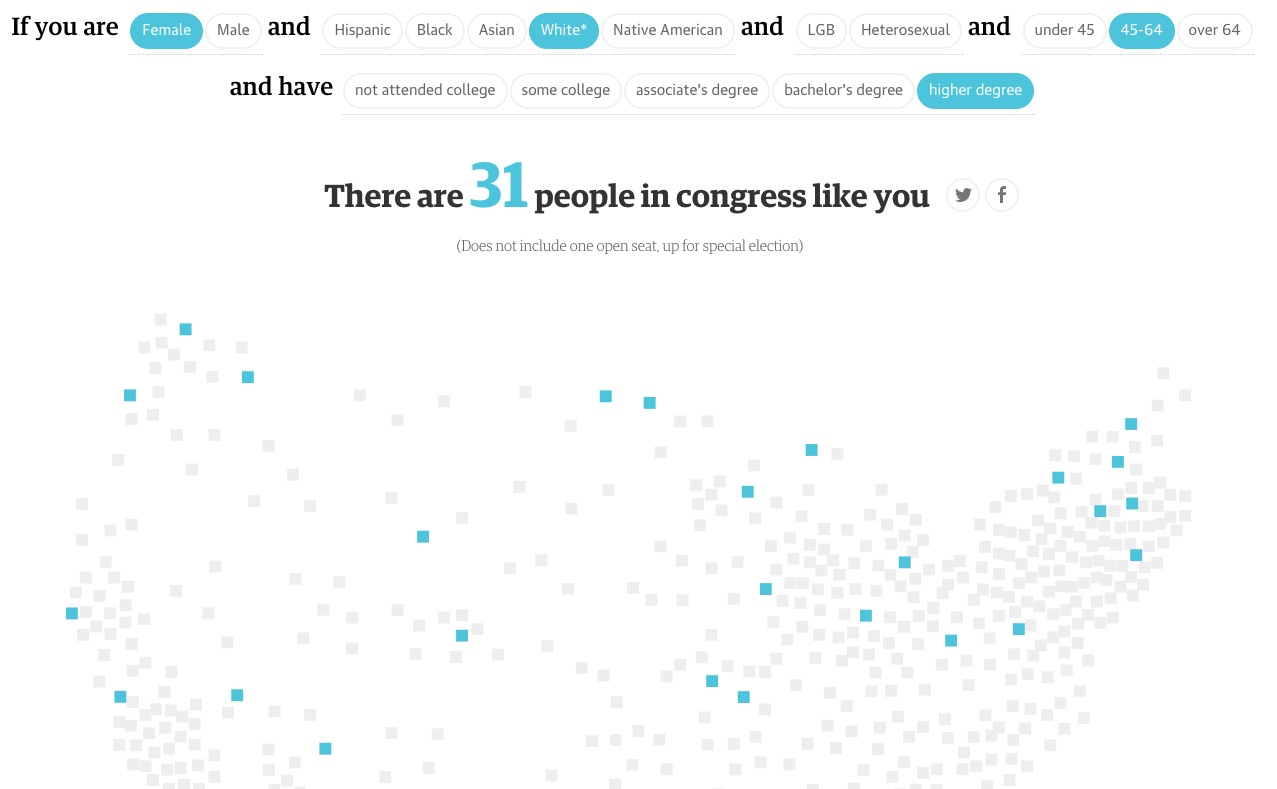
The Guardian, _Are you reflected in the new Congress.
####READINGS
- Few, S., Data art vs. data visualization.
- Koc, E., Interactive storytelling at the New York Times.
- Slobin, S., Examples of data journalism.
####PRACTICE Continue to practice your fluency in Github commands with this online interactive tutorial.
Finish the exercises on the Basics of HTML/CSS Practice Site.
Here are some other resources for Github learning:
- Gitualize - visualize github commit activity
- Is it maintained - check the github status of a repository
- Girl - check the github readme link status to make sure your README.md is solid and without broken links
####ASSIGNMENT Think about who handled it (that is, the topic) better:
- Motherboard: https://www.muckrock.com/drone-census/
- Muckrock: https://www.muckrock.com/drone-census/
- Pitch Interactive: ttp://drones.pitchinteractive.com/
- A Quiet Disposition: http://aquietdisposition.com/
Why? How? What aspects are more or less compelling, what would you say is a better approach to communicating this material?
Consider the pieces and work shown by the guest lecturer, highlight some aspect of their work that seemed very difficult to you and find some resources online detailing how you would develop skills to support what you find difficult. Maybe they have to code, maybe they have to test, maybe they have to make high quality mockups in Illustrator. Pick something they describe that you don't understand and find ways to learn about it so you might be better prepared to deal with that in the workplace.
##9/23/15
####DATA-DRIVEN JOURNALISM ####NO CLASS: Yom Kippur
There will be no class on this date, but I would like you to investigate datasets and topics for your final project during this break week, and do the readings and exercise below. The makeup course will be the final project presentation day, a chance to workshop your projects as well, held on 11/24/15.
"Narrative can on the one hand be broken down into a set of universal laws and principles that may transcend mediums. Stories have temporality in common (they deal with time) as well as causation (they deal with cause and effect of something). On the other hand there are the more media specific narrative affordances as for example in the way that film, opera, novel and data visualisation – because of their physicality and the dimensions open to them – would be able to give a different ‘staging’ of a story." ~ C. Twigg
What is data-driven journalism and what kind of stories can it help us convey? How does it relate to art, and why are visualizations such an important component to interactive development? This week, we'll identify some data sources to support solid narratives.
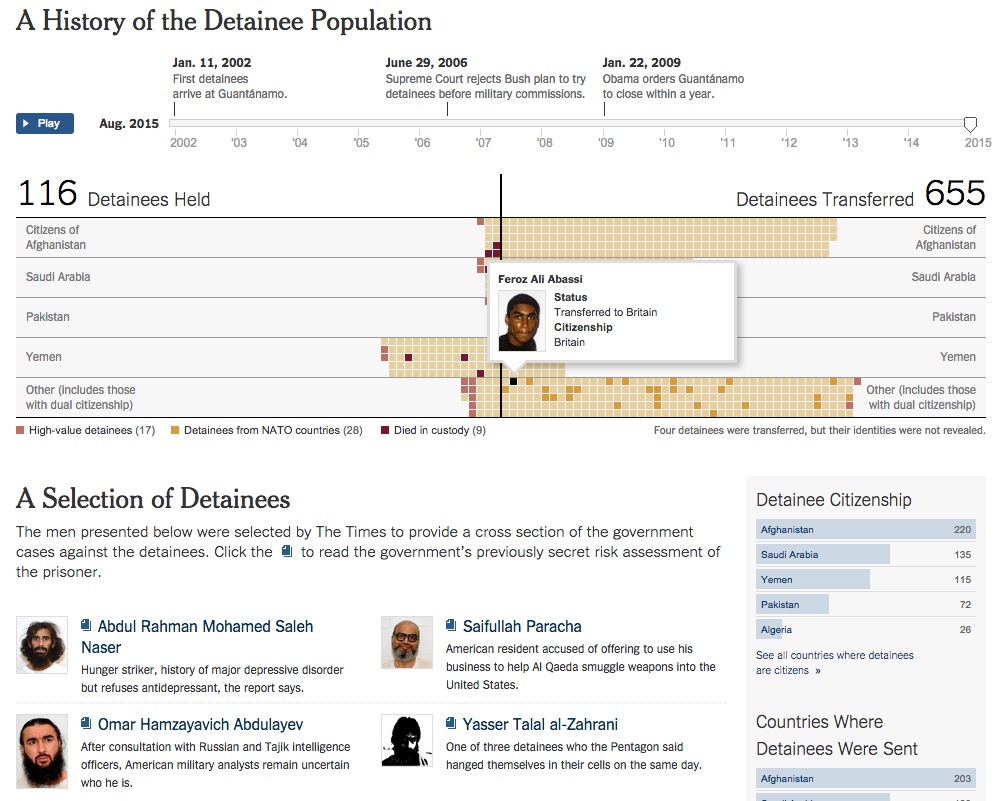
Interactive to Inspire:
- NYTimes (2014), Guantanamo: A History of the Detainee Population.
####READINGS
- Data Art Net, A Visual History of Data Visualization.
- Emery, A., The DataViz design process.
- Harris, J., NYTimes: How the data sausage gets made.
The following are mostly data resources, feel free to use them for the assignment or seek your own dataset.
- GIJN, Tools for visualization, data analysis, mapping, statistics etcet..
- Journalism Tools, Data Analysis, Scraping + Resources.
- Journalism.org, Datasets.
- Knight Center for Journalism, Data Visualization Resources and Ideas.
- Moser, A. + friends, Federal datasets
- Pitts, R., Journalists guide to datasets.
- Awesome list of open access datasets
OPTIONAL READINGS
####PRACTICE In prep for our study of maps and extra-journalism interactive platforms, evaluate the utility and validity of Pattrn's projects.
Including The Gaza Platform, a partnership with Amnesty Intl.
####ASSIGNMENT Do some research, find a few stories that inspire you, or some that don't. Think about what data they use to prove their assertions, or what datasets might help to bolster their arguments.
Consider if you could develop a visualization to support that topic, or study it further. Consider what open data sources you could use (see those listed in the readings above); consider what closed data sources you might try to solicit (check out this Five Minute Field Guide to find data relevant to your idea).
Try to find one or two datasets that suit a narrative or argument you'd like to build. Write 1-3 paragraphs about:
- what datasets you chose
- why you chose them
- what story you might like to tell
- what type of data you have (time-series, geospatial, graph data)?
- how you expect your audience to engage with those data.
Link to the datasets if they are available online, if not, explain how you intend to get those data over the course of the next few weeks.
##9/30/15 ####STATISTICS AND TIME-SERIES INTERACTIVES
"In short, we're tasked with transforming data into directives. Good analysis parses numerical outputs into an understanding of the organization. We "humanize" the data by turning raw numbers into a story about our performance." ~ J. Bladt + B. Filbin
This week kicks off our visualization series, we'll be exploring data sets for time-series interactives and statistical charts/graphs.
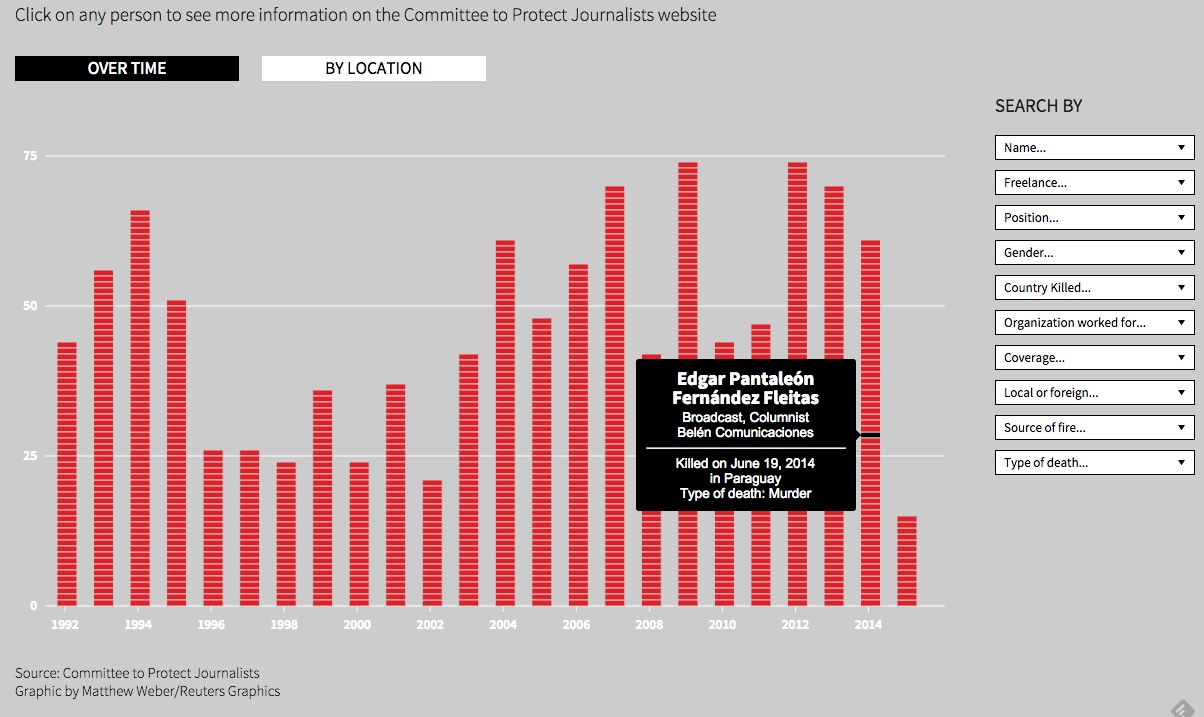
Interactive to Inspire:
- Reuters Graphics, Journalism Deaths.
####READINGS:
- Bladt, J. and B. Filbin, Data Scientists' real job: storytelling.
- Carr, D., At the front lines, bearing witness in real time.
- Dubakov, M., Visual Encoding.
- LaFleur, J., Guide to bulletproofing your data.
####PRACTICE C3.JS is a reusable chart library based on D3. Take a look at the code for this Timeseries Chart and think about how you could modify it to accommodate data of your choice.
Try to do that and integrate your practice into the assignment below (add it to you bl.ocks account if you can!).
Here is an example using C3.JS for a categorical bar chart. If you feel like this is more relevant to your dataset, you can use that template too.
####ASSIGNMENT
- Find some time-series or statistical data.
- Think about the narrative that you might build around it.
- Write a pitch (< 3 ¶s) explaining your story and linking to the data.
- Defend your pitch in a few short arguments, describing the format of your data, and what tools/languages you would use to explore and visualize it.
- Use your practice exercise to defend your pitch with a prototype.
##10/7/15 ####(COUNTER)MAPS AND CARTOGRAPHICS
"It's turtles all the way down" ~ Wikipedia
This week we'll explore geospatial data and mapping visualizations. We'll consider cartography as a method of storytelling on a fairly intuitive canvas, and we'll explore a few tools that help you parse geographic information.
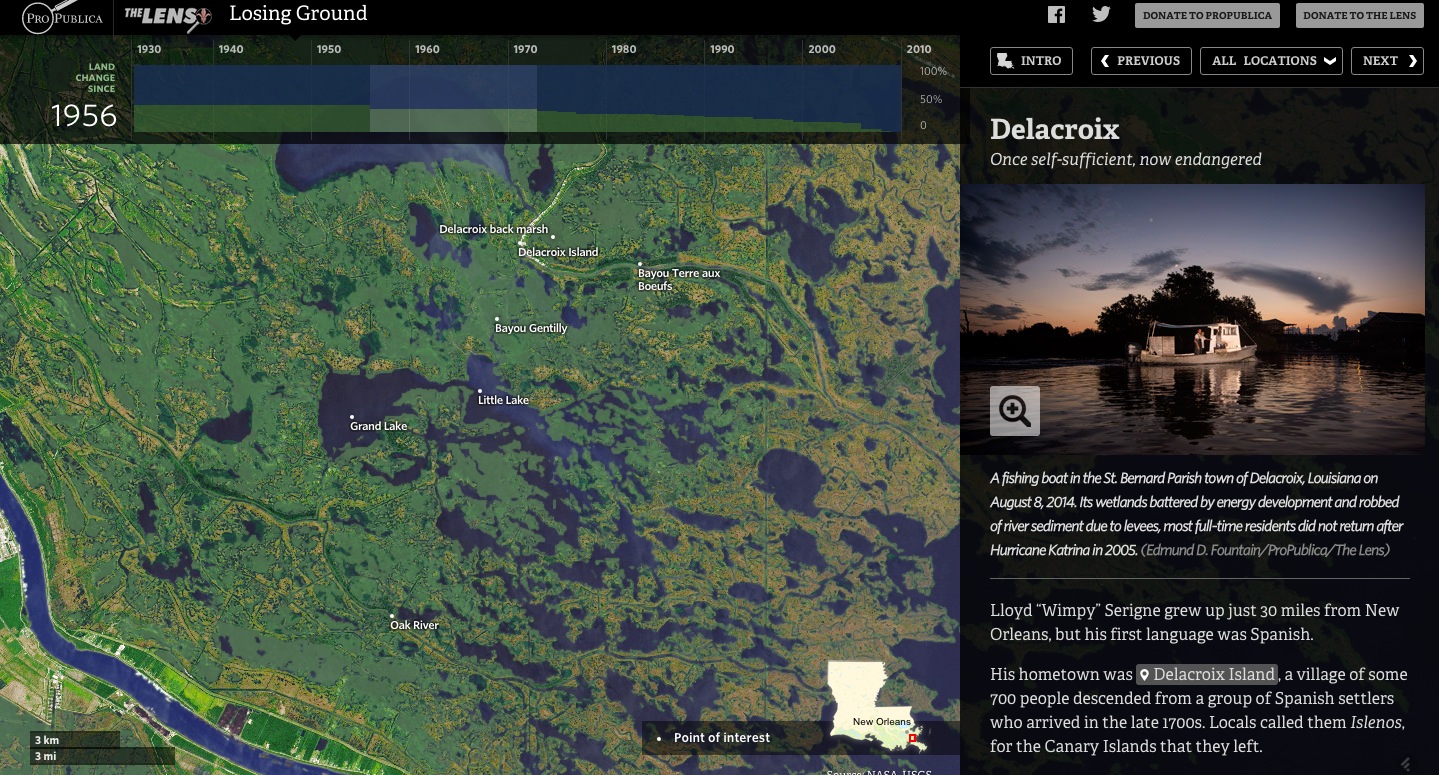
Interactive to Inspire:
- ProPublica, Losing Ground.
####READINGS
- Larson, J., Anatomy of a News Map.
- Madrigal, A., How Google Builds Its Maps – and What It Means for the Future of Everything The Atlantic (September 5, 2012).
- Tolochko, R., Introduction to the Geo-command line.
- Wiseman, A., When maps lie.
Check these out:
- Eschbacher, A., Map Academy.
- Hurt, A. et al., Disputed Territories. Github.
- Radical Cartography.
####PRACTICE CartoDB is an online mapping platform and series of libraries/APIS that allows you to map geospatial data easiy in Javascript.
Here is an example using CartoDB.JS for a Census tract visualization of water quantity.
Here is a more complex example with button selectors for exploring data and reloading layers.
Try to modify the code the match your own data and integrate your practice into the assignment below.
If that seems overwhelming, try to follow these tutorials instead:
- Tutorial: Creating your first map with CartoDB.JS.
- Map Academy: Online mapping for beginners
- Map Academy: Carto.JS
####ASSIGNMENT
- Find some geospatial data.
- Think about the narrative that you might build around it.
- Write a pitch (< 3 ¶s) explaining your story and linking to the data.
- Defend your pitch in a few short arguments, describing the format of your data, and what tools/languages you would use to explore and visualize it.
- Use your practice exercise to defend your pitch with a prototype.
Consider this interactive and how you would construct a pitch for the narrative there. Think about that when you write your pitch.
##10/14/15 ####NETWORK AND GRAPH VISUALIZATIONS
This week we'll consider visualizations that illustrate spatial relationships between data points (nodes) via (edges). We'll play with a few tools and explore graph data or relationships worth teasing out of your chosen datasets.
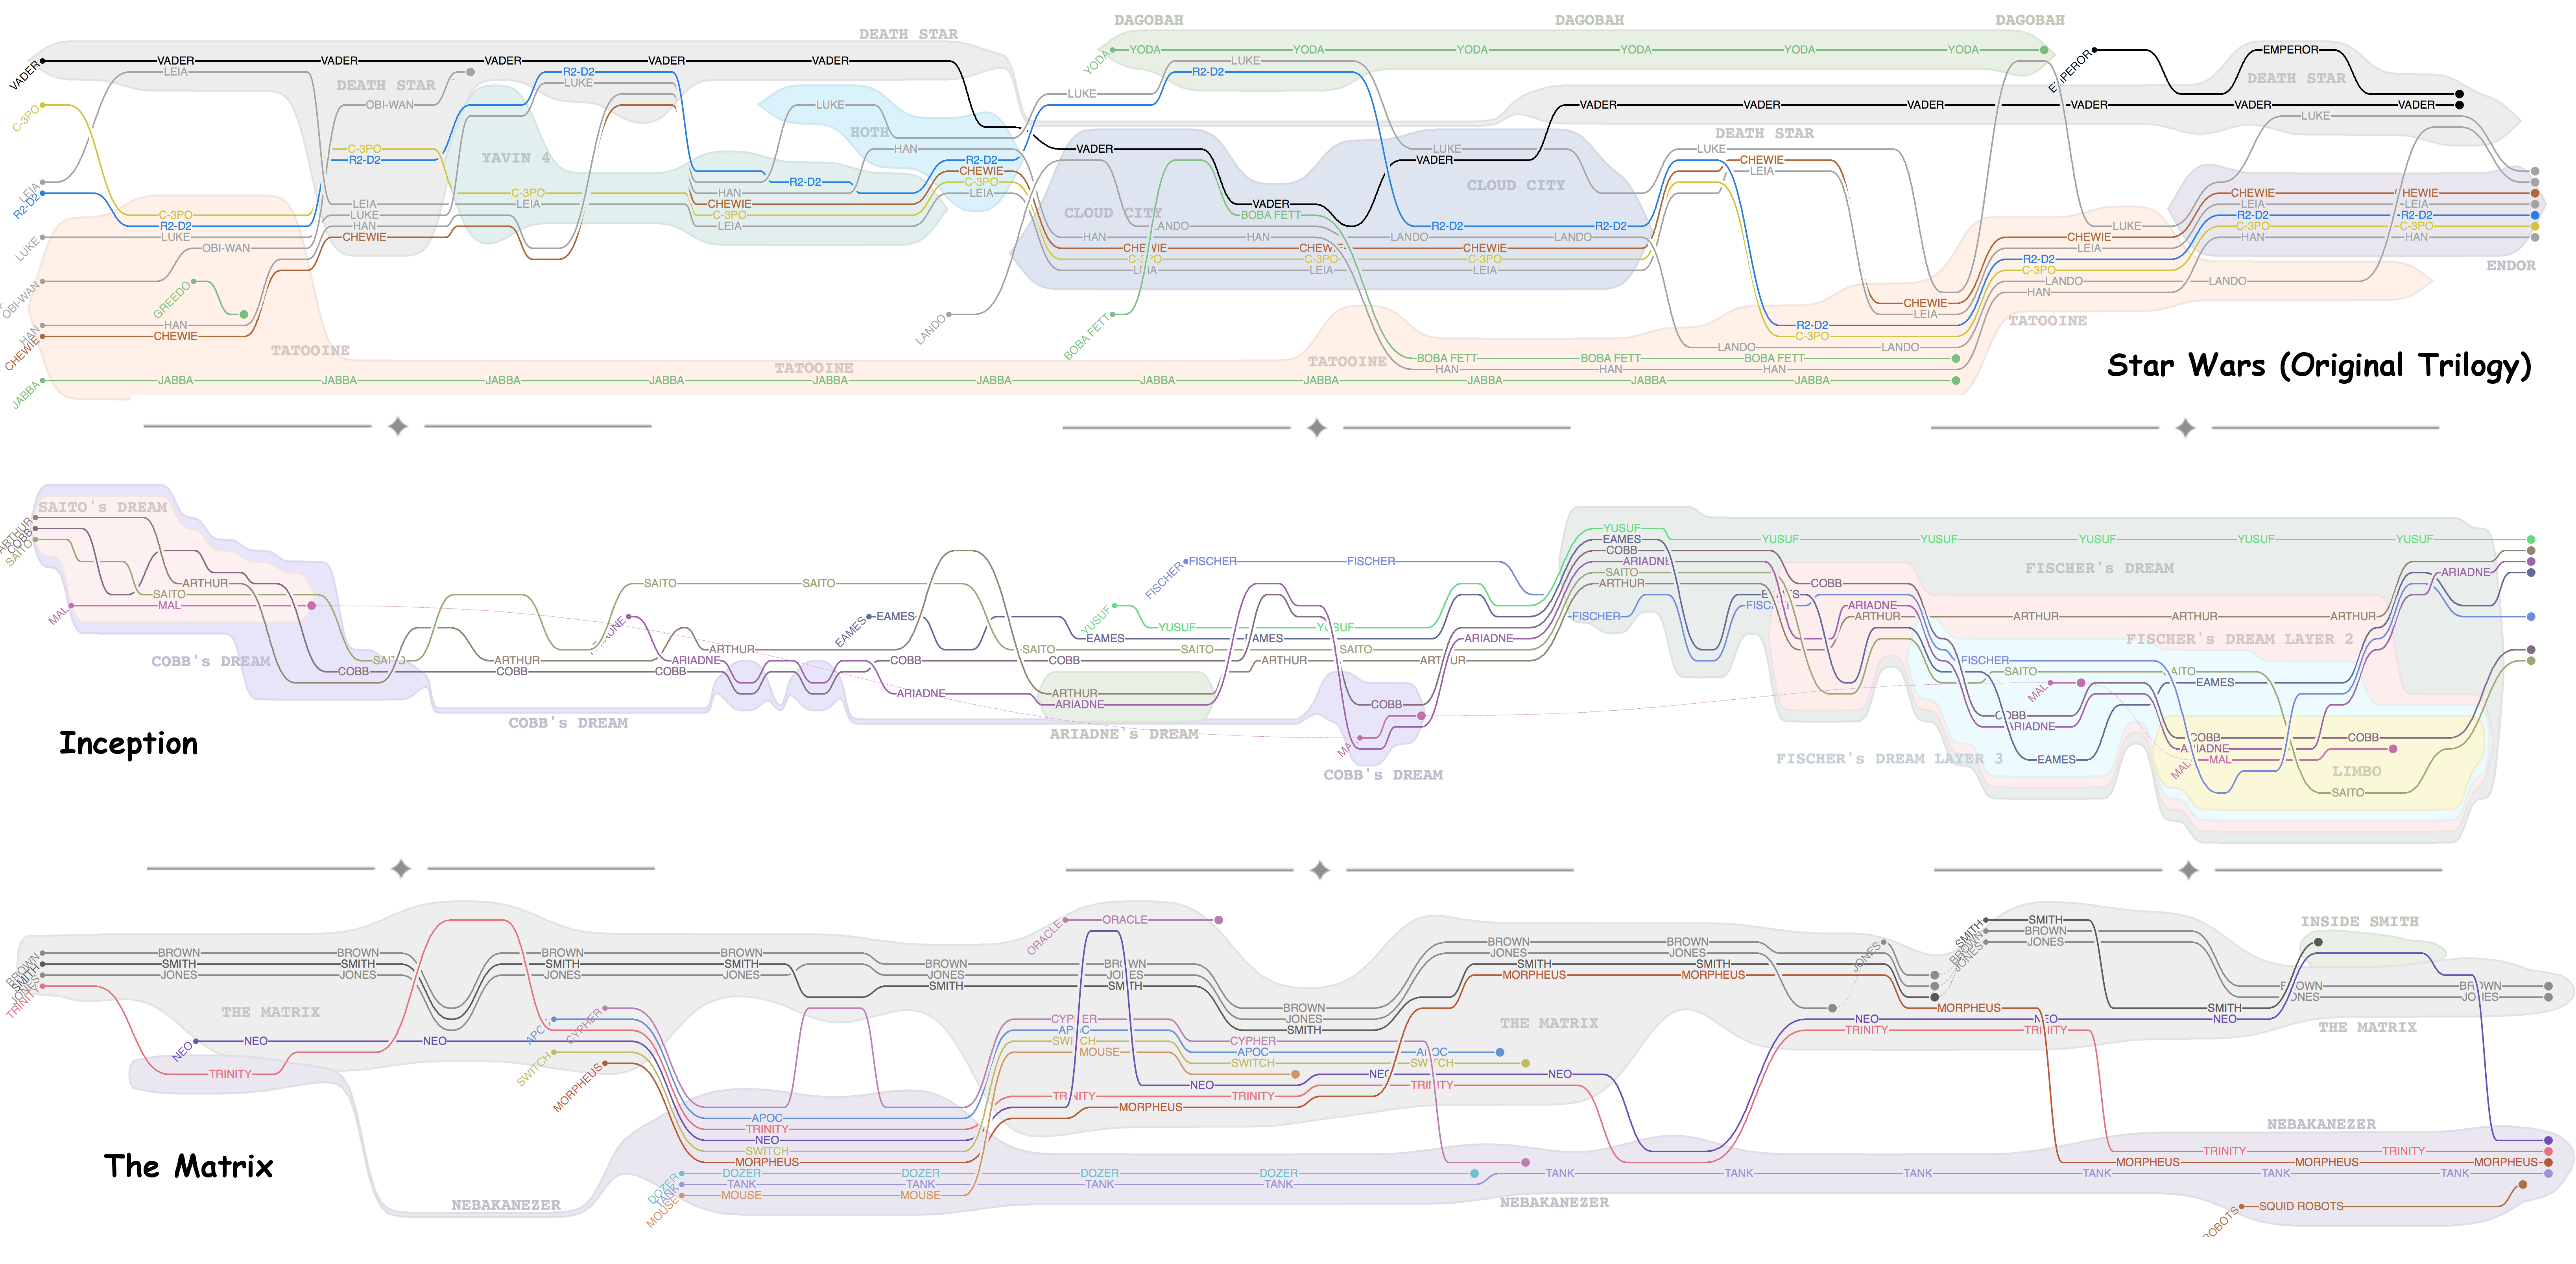
Interactive to inspire: Tanahashi, Y., UC Davis, StoryLines You can read their paper on the topic here.
####PRACTICE There are various JS tools for building graph visualizations, Sigma.js and Arbor.js among them. Peruse the examples available using these libraries online, or try Gephi, a free desktop tool for visualization.
Here's a sample visualization that uses Gexf to visualize graffiti artists and their formal art influences, color-coded by country of origin.
Try to build a prototype with one of these libraries/tools to support your assignment pitch.
####READINGS
- Tamassia, R., Handbook of graph drawing and visualization.
- Tarawneh, R.M., et al., A general introduction to graph visualization techniques.
####ASSIGNMENT
- Find some network/graph data or a collection of datasets that you think might compliment eachother, or might reveal something interesting in ensemble.
- Write a pitch (< 3 ¶s) explaining your story and linking to the data.
- Defend your pitch in a few short arguments, describing the format of your data, and what tools/languages you would use to explore and visualize it.
- Use your practice exercise to defend your pitch with a prototype, or at least choose one dataset, one library and try to describe how in specific you think they partner appropriately.
Alternatively, for your assignment, you can try to make a Graph Visualization with sample data (say from Sigma.js's examples page, or from another graph example/library), or follow the following tutorial, take notes on your experience and screenshots of your work along the way.
##10/21/15 ####COLOR THEORY: ART, DESIGN, + PERCEPTION
"It’s not uncommon for designers to confuse a beautiful looking product with one that works beautifully. A great technique for creating smarter, better products is to approach them using story-centered design." ~ B. Kowitz
Color and mood are important to visualizations and the general legibility of your narrative. We'll discuss ways to convey or amplify your story with design, and think through some of the aesthetics of your interactives to come.
Interactives to inspire:
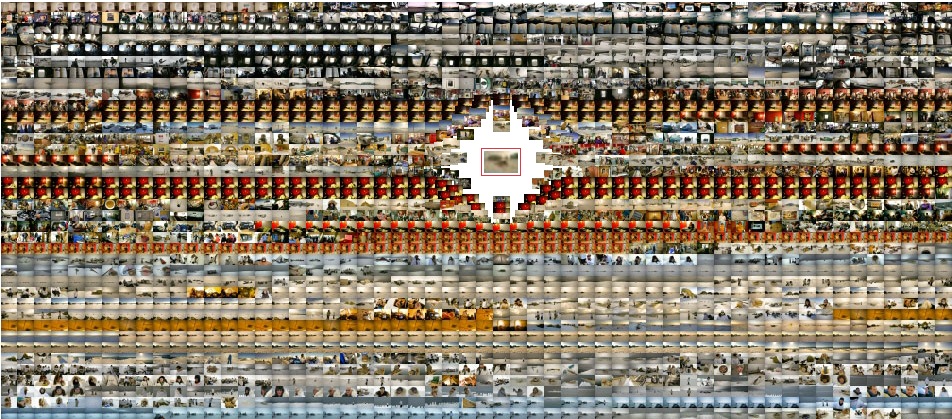
- Harris, J., Whale Hunt.
- Harris, J., I love your work.
####READINGS:
- Huval, R., The Color of Disruption.
- Kemery, A., StoryBoarding your data visualizations.
- Lin, M., A color palette optimized for data visualization.
OPTIONAL READINGS:
- Kowitz, B., [Why good storytelling helps you design great projects]https://gigaom.com/2013/04/14/why-good-storytelling-helps-you-design-great-products/).
####ASSIGNMENT Make a few sketches of the data visualizations that might suit your project, take a photo of those sketches and create a style guide or swatch board (with color palette, fonts, layout indications) in a gist. These can build on your prototype time-series, mapping, or graph visualizations from previous weeks, but should reflect your "ideal" layout and not be limited to what you were able to accomplish in previous weeks.
It doesn't have to be as detailed as this one but it should have a few main sections:
- Colors (hex values chosen)
- Fonts
- Template (general layout, with sketches-hand sketched and photographed/embedded in a gist or uploaded somewhere.
- Description of the dataset(s)
- Description of the concept and larger narrative - what aspects of your data will this style highlight?
##10/28/15 ####CHOOSING AN INTERACTIVE
Choosing a way to display your data is a non-trivial operation, and using the past few weeks' study of a few general visualization types, we'll discuss what combination of visual data diagrams best suit the data we've groomed for our final projects. We'll also go over some of the tools for rendering those data as such.
Interactive to Inspire:
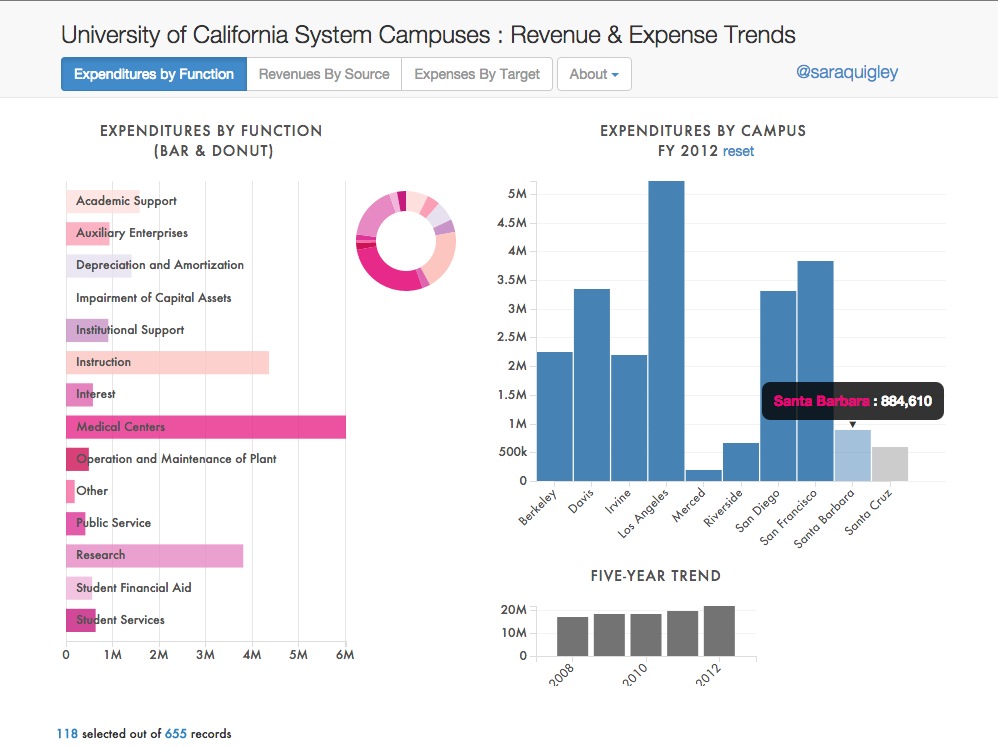
- Quigly, S., UC Campus Expenditures Interactive Dashboard.
- Using DC.JS.
####READINGS
- Oetting, J., Choosing the Right Chart.
- Salkever, A., How to Choose the Right Visualization.
####ASSIGNMENT - PROPOSAL Consider the data visualization types in this catalogue, and the tools listed here.
Determine which type of visualizations you might make with your data, list them, and then select one to test and pursue.
Diagram (aka, discuss in one ¶) what type of visualization you choose for your dataset and what tools you will use to achieve this (include the languages they are written in or the languages you might need to code in).
Keep in mind how this changes or updates your style guide from last week; update that assignment where necessary; and link to the style guide at the end of your proposal.
##11/4/15 ####CREATIVE NARRATIVE
"And I want you to ask yourself when you make things, when you prototype interactions, 'am I thinking about my own clock, or the user’s?' Am I going to help someone make order in his or her life, or am I going to send that person to a commune in Vermont?" ~ P. Ford
This week we'll talk about creative approaches to building narrative and new methods for publishing interactive material. We will likewise learn more about hosting our projects on github or otherwise.
"Every dance is a kind of fever chart, a graph of the heart." ~ M. Graham
Interactive to Inspire:
- Bloomberg, "What's really warming the world?.
####READINGS
- Ford, P., 10 Timeframes.
- Honan, M., Inside the buzz-fueled media startups battling for your attention.
- Bajak, A., How to learn responsive web design by coding your own news article.
- Keller, M., Comics: Terms of Service.
- Using Pulp: An AJAM Project.
- Case, N. + Hart, V., Parable of the Polygons.
- Stikeleather, J., How to tell a story with data.
####PRACTICE Think about where you would like to publish your project and in what format. Will it be a stand-alone site with some text, a text-dense narrative with embedded graphs, a larger scroll-pages multimedia piece with images and video embeds to compliment?
####ASSIGNMENT Think about the interactives we've seen this semester and plan out your template layout.
Reconsider your data and the pitch exercises from previous weeks, choose the best visualization and pitch for your narrative and pursue pushing that onto the web.
Here are some resources to help you get it on the web.
Here is an example of an interactive time series visualization of Graffiti cleanup rates (taken from 311 data). Here is the code and readme explaining how this was made. This will be the format of your final projects (unless you choose a more creative way of hosting it). All of your code will be submitted on github with at least a link to the live demo in the README.md of your repository.
###11/11/15 ####UNDERSTANDING IMPACT + ADDRESSING BIAS
"I realize there’s a whole lot of inspiration out there, and some damn fine examples of great work, but I still find it hard to get a sense of direction...We need to know what makes a data story “work”. And what does a data story that “works” even mean?" ~ N. Diakopoulos
This week we'll go over how to process reactions to your work, and how to bulletproof your story accordingly, pre-publication.
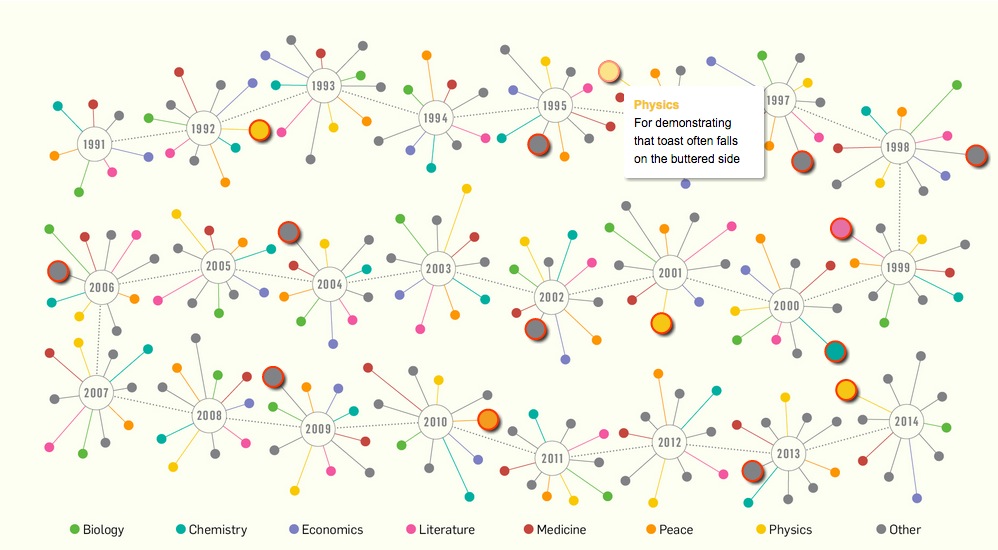
Interactive to Inspire:
- Popular Science, Interesting Nobels, (8/18/15).
####READINGS
- Konnikova, M., What Makes a Story Go Viral?.
- Medium, What is Impactful? Or statistics at the service of stories.
- Reynolds, G. The secret of storytelling is in the editing.
- Schepers, A., Bordering on Factual: Fact Check Before Sharing.
- _WordSafety.
OPTIONAL READINGS:
- Diakopoulos, N., Storytelling with data: what are the impacts on audience.
- Hess, A., The Bro Whisperer of Bustle.
- Jefferson, C., The Racism Beat: What it's like to write about hate over and over again.
####ASSIGNMENT
Continue with last week's assignment, work on publishing your project on github, posting the interactive on gh-pages, and explaining your process, sources, and reasoning in your README.md.
##11/18/15 ####THE FUTURE OF MEDIA + FINAL PROJECTS
"I realize the instant communication platforms we enjoy now do have some negatives that are troubling." ~ J. Spann
Meet with your project partners to discuss how you plan to wrap-up your projects over the next week.
Interactive to inspire:
####READINGS
- Carr, D., Magazine writing on the web, for film.
- Haile, T., What you think you know about the web is wrong.
- Klein, E. et al., Mantra: "We'll always be a work in progress".
- Spann, J., The age of disinformation.
- Tow Center, Anatomy of a Robot Journalist.
OPTIONAL READINGS
- Anderson, C., How to give a killer presentation.
- Rosling, H., TED talks.
####ASSIGNMENT Continue with working on your final projects.
-
publishing your project and code on github
-
post the interactive demo on
gh-pages -
explaining your process, sources, and reasoning in your README.md with the following sections:
- Project Title
- Desciption
- Demo Link
- Project Procedure: describe your data processing, visualization selection, and analysis post-visualization
##11/24/15
####PRESENTATIONS AND PROJECT CLINIC
"Give your characters opinions. Passive/malleable might seem likable to you as you write, but it’s poison to the audience." ~ Pixar, 22 Rules of storytelling.
Tues., 11/24, 6-7:50PM, Make-up for Yom Kippur Course
This will be a follow-up lab to polish your projects and get extra-help. I realize it's before Thanksgiving and this might be a tense travel time for you. Sorry about that, the New School mandates that the make-up is on this day.
####READING
- Ford, P., What is Code?.
####FINAL PROJECTS DUE: 11/25/15 9AM, in my inbox.
Please send the link to your project repository and any supportive materials to my email mosera@newschool.edu.
Final Project Guide: https://gist.github.com/auremoser/6cdf8d61bb3bcbba7606
We will spend the first minutes of class going over your project pitches, please send me your current assignment/latest project draft before class, and prepare a 3-5 minute presentation of your project, describing why you chose it, what resulted from your efforts and what you would like to do with the project moving forward.
But in general, this project is a big deal! The final project is a substantial portion of your grade, and there will be no late grading because they lock me out of the grading system 7 days after our last class (around the 26th); ie. no late grades accepted.
#SERVICES + RESOURCES
###CODE (OF CONDUCT) It's not that hard, code or respect. You will be expected to produce both in this class. We will set the tone for it here, so you can graple with its absence from an informed position in the workplace.
Part of that code of conduct is a partnership we are building in mutual respect. I take it personally when you miss my classes and my assignments; being ontime is a way to show myself and the other students that you have respect for us. If you fail to do that, you're hindering your own education, but more importantly you're hindering your reputation as a person with integrity.
Here are a few general things:
- Late assignments will not be accepted
- Attendance is mandatory barring an emergency which you can work out with the instructor over email.
- Regardless of circumstances, you're expected to turn in your assignment on the day that it's due, and otherwise keep up with work.
The university provides many resources to help students achieve academic and artistic excellence. These resources include:
- The University (and associated) Libraries: http://library.newschool.edu
- The University Learning Center: http://www.newschool.edu/learning-center
In keeping with [the university’s policy] (http://www.newschool.edu/student-disability-services/) of providing equal access for students with disabilities, any student with a disability who needs academic accommodations is welcome to meet with me privately. All conversations will be kept confidential. Students requesting any accommodations will also need to contact Student Disability Service (SDS). SDS will conduct an intake and, if appropriate, the Director will provide an academic accommodation notification letter for you to bring to me. At that point, I will review the letter with you and discuss these accommodations in relation to this course.
###UNIVERSITY POLICIES There are a few; including the Academic Honesty and Integrity Policy, Intellectual Property Rights Poly and Plagiarism Policy.