Skip to content

In this I have created a covid tracker dashborad that will represent how many cases are found per states.It includes confirmed cases, deaths,recovered per statewise.

Notifications You must be signed in to change notification settings

Akshat2Jain/Covid_statewise_tracker_dashboard

Folders and files

NameName
Last commit message
Last commit date

Latest commit


History

20 Commits


Repository files navigation

Covid_statewise_tracker_dashboard

Find the code above

In this I have created a covid tracker dashborad that will represent how many cases are found per states.It includes confirmed cases, deaths,recovered per statewise using Html Css Vanilla Javascript Screenshot from 2022-03-09 19-34-06

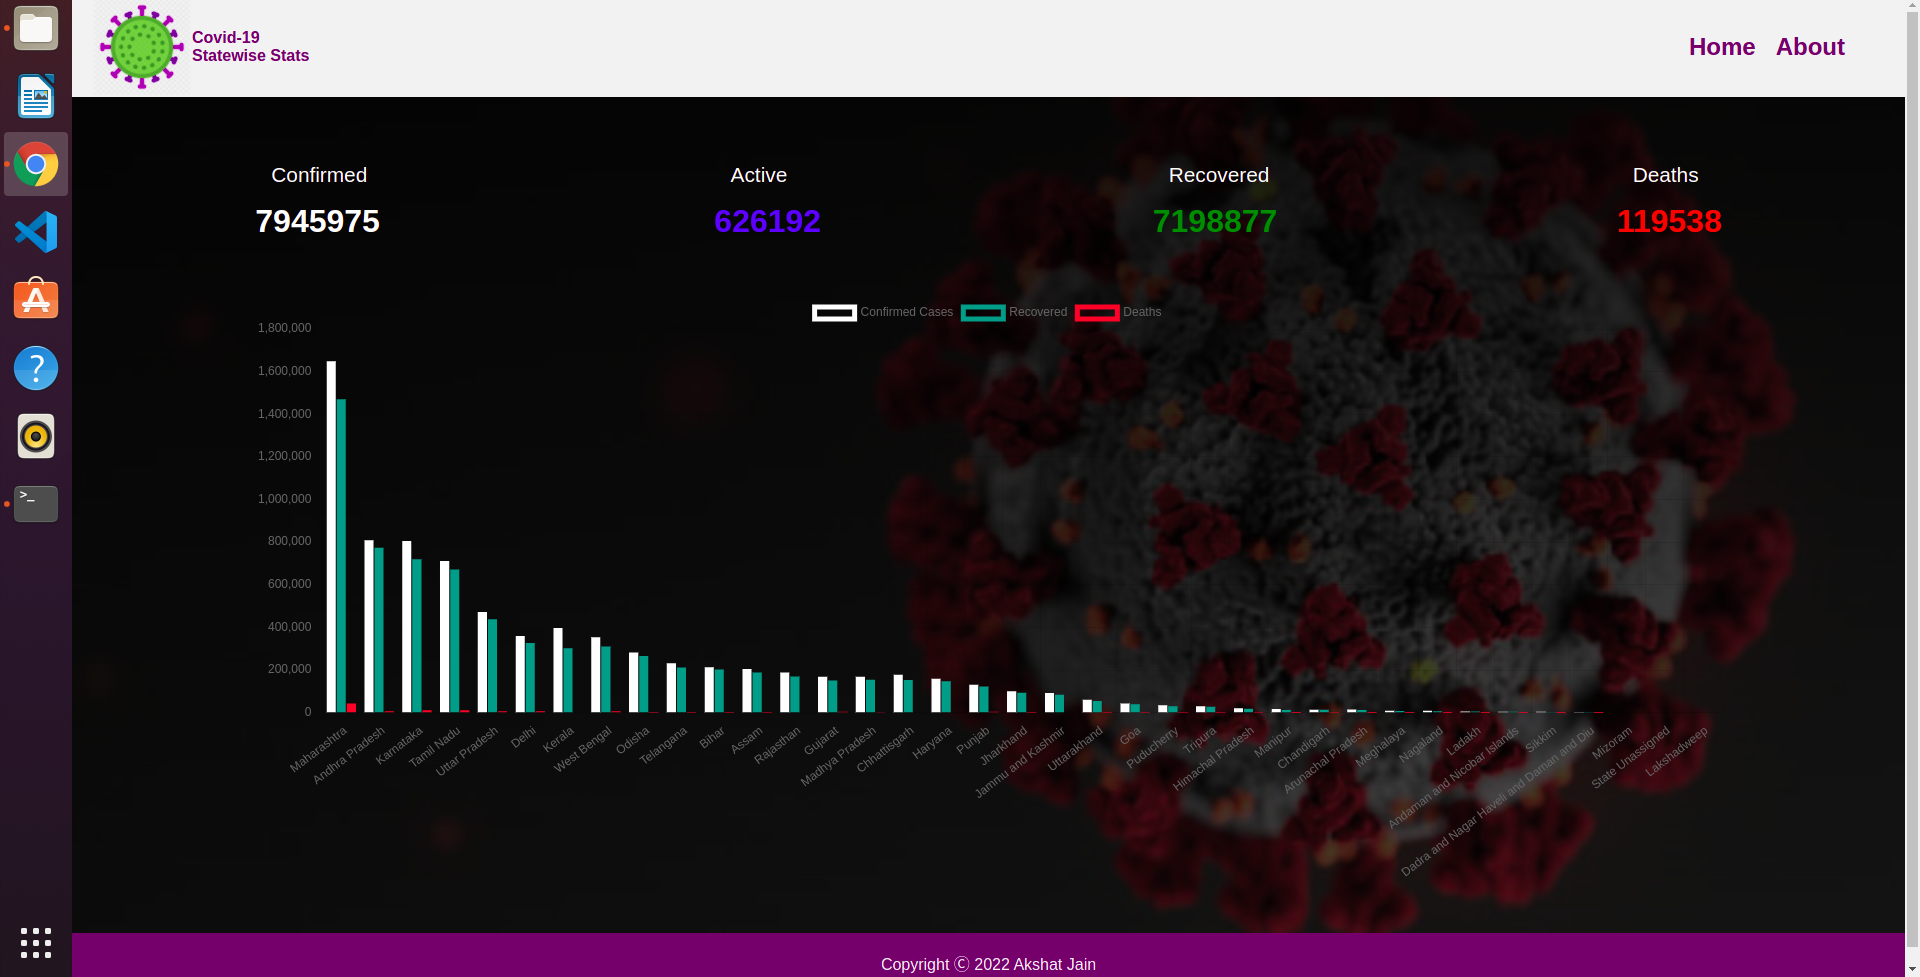
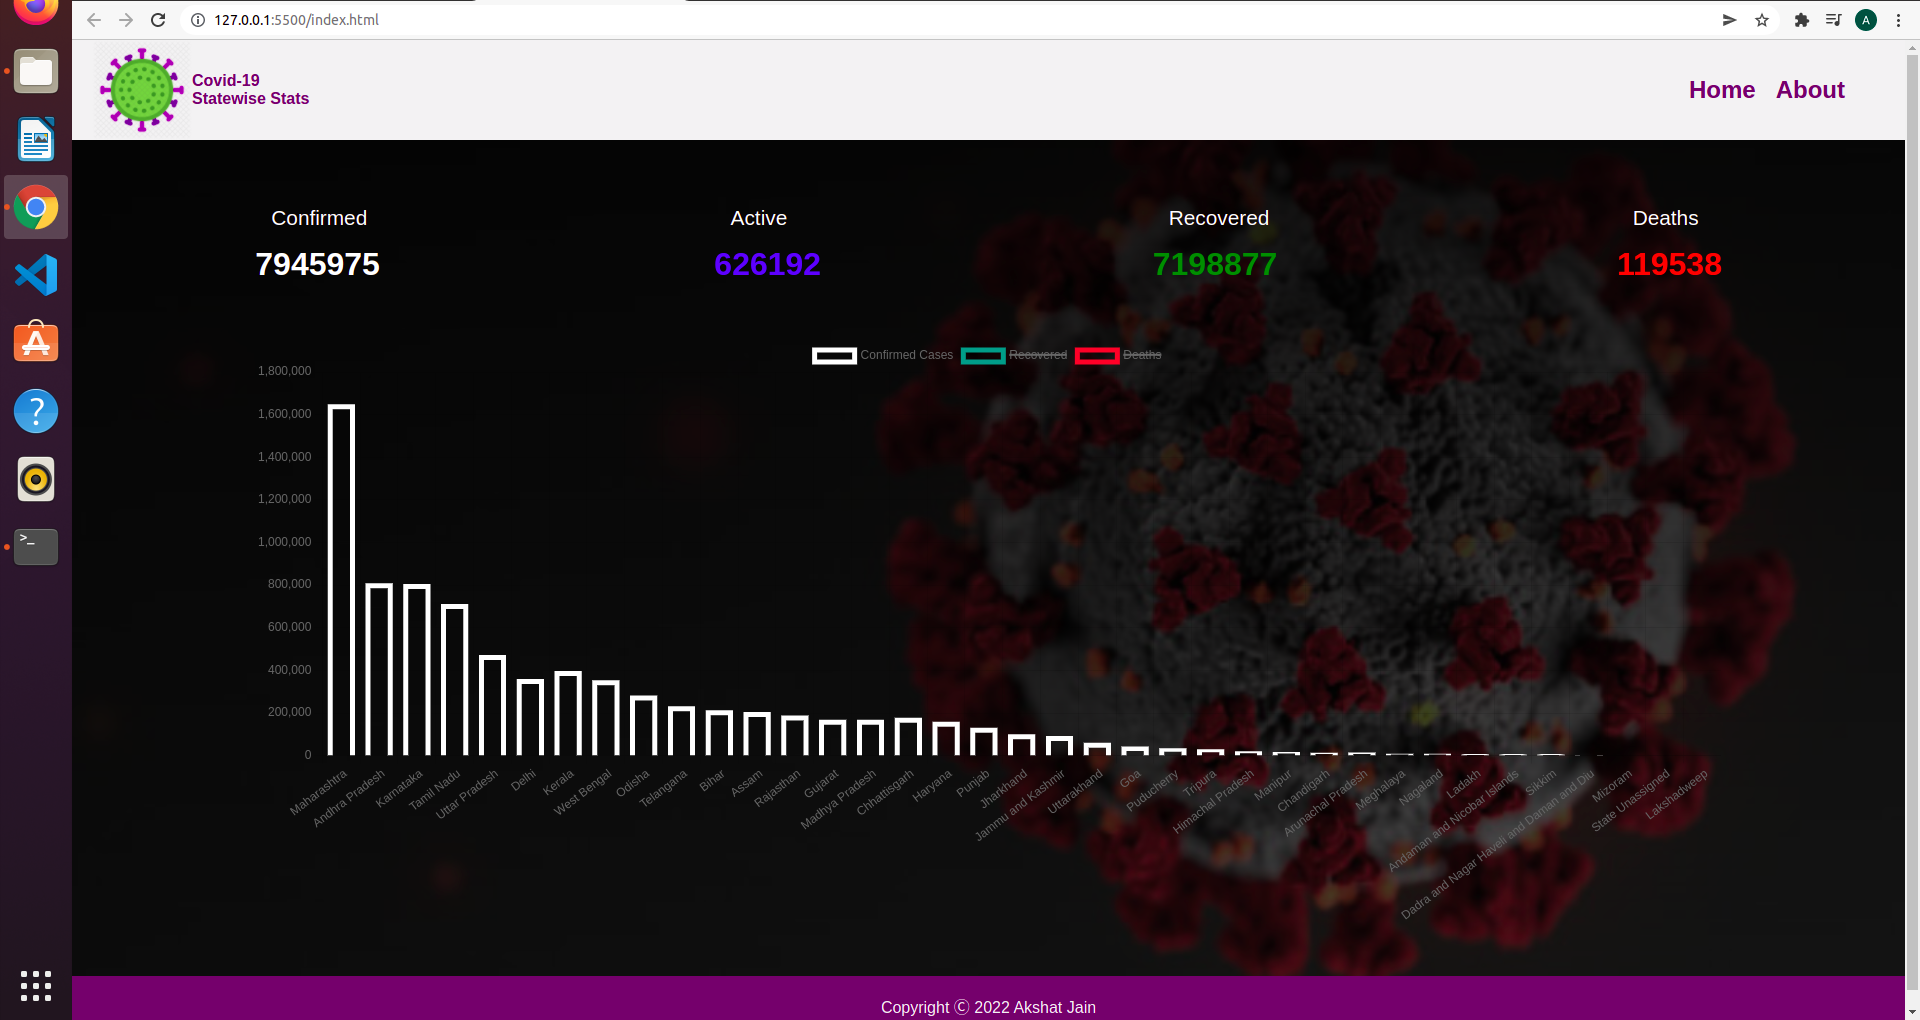
It shows Confirmed Cases. Screenshot from 2022-03-09 19-34-32

It shows recovered cases and deaths per states. For chart I have used chat.js labeled one dimension as states and another dimension as number of cases

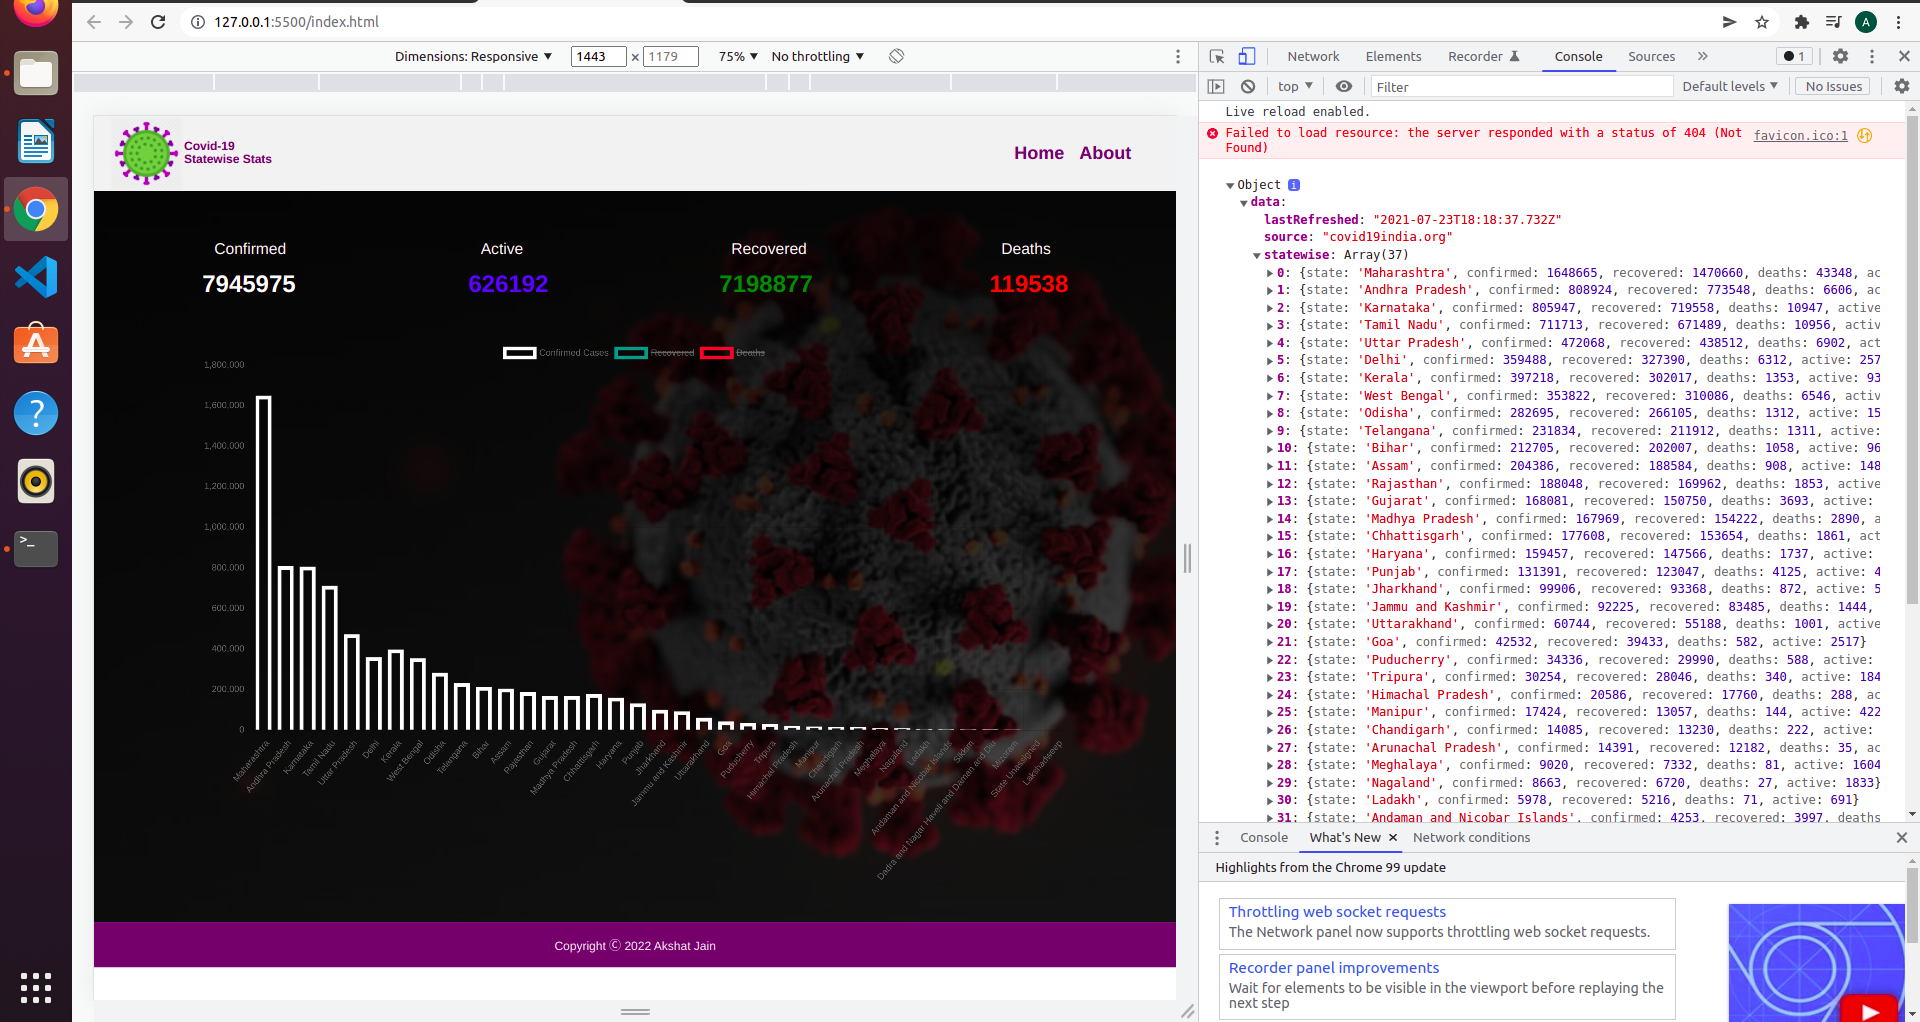
Data Came from a api got it from rapidapi but it shows data from march 2020 to october 2021

Screenshot from 2022-03-09 19-35-06

It is also fully responsive

Screenshot from 2022-03-09 19-37-31

In this I have learned how to apply chart.js library and how to fetch the data from a api

Thank You

About

In this I have created a covid tracker dashborad that will represent how many cases are found per states.It includes confirmed cases, deaths,recovered per statewise.

Topics

Resources

Stars

Watchers

Forks

Releases

No releases published

Packages

No packages published